The stock market has had a strong run higher since making a bottom in January. Since then the S&P 500 is up over 8% and the Transportation Index nearly 10%. That has brought the S&P 500 back to its all-time high area. The Nasdaq 100 is also at all-time highs and the Russell 2000 only slightly below. But despite the strength of the transports this year they continue to lag behind the rest of the market longer term. Over the last 12 months transports are nearly flat.
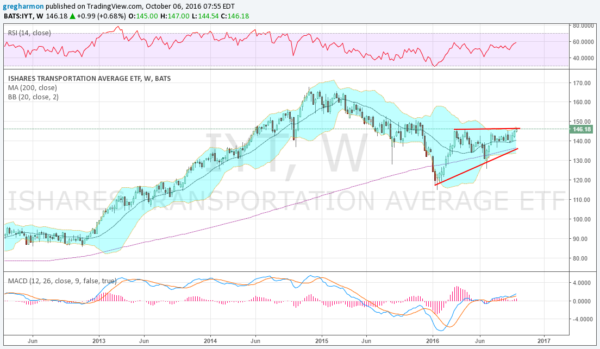
In fact looking at the chart of the iShares Transportation Average (NYSE:IYT) below you can see it remains nearly 13% below its November 2014 peak. What gives? Well the past is the past and the chart also shows that after a long correction, a strong bounce and consolidation, the Transports are rested and ready to run with the bulls.

This is significant. A change of character to an uptrend in the transports would add strength to the broad market. The move this week to resistance is getting that started. A push over the resistance that has been in place since early this year would establish a short term target of over 170 on the ETF. That is a new all-time high. longer term it sets up a broad scale AB=CD pattern with a target to 200 and projected timeframe of January 2018. Momentum indicators support this price action, both in bullish zones. Will Friday’s jobs report be the catalyst?
The information in this blog post represents my own opinions and does not contain a recommendation for any particular security or investment. I or my affiliates may hold positions or other interests in securities mentioned in the Blog, please see my Disclaimer page for my full disclaimer.
