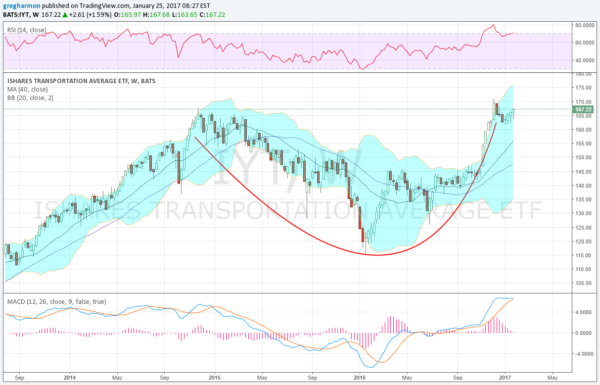
The Transportation Index took a much needed rest from the start of 2015 through the end of that year. During that time the rest of the market didn't do much while the Transports gave back nearly 30% of their value. They showed some promise at the start of 2016, rising 20% quickly in the first 2 and a half months. But that too fizzled out as Transports moved sideways for the next 8 months.
So as the stock markets entered November -- with the Industrials, S&P 500, Russell 2000 and Nasdaq 100 sitting at record highs -- the Transports were still 12% below their high-water mark. The election ignited the markets, though, and this time the Transports participated, rising more than 15% in 5 weeks, finally making a new all-time high. Since then, Transports have digested the move.

Now, as earnings are coming out, it looks as though the Transports have caught their breath and refreshed themselves for another leg higher. The chart above shows a Cup-and-Handle pattern, triggering on a weekly time frame. This pattern would set a target on the upside to 210 for Transports ETF IYT. Skeptics would point to the RSI on the edge of being overbought and a flat MACD as risks of a pullback. But one need only look left on the chart to the run from mid 2013 through 2014 to see both can maintain these levels for a long time.
