For the traders out there it’s a huge week, with 24% of the S&P's market cap due to report, the USD pushing through 98 and the highest levels since early March. USD/CNY and USD/JPY are the ‘must watch’ FX pairs of the week, with a close in USD/JPY above ¥104.32 likely to be taken very positively by the USD bulls.
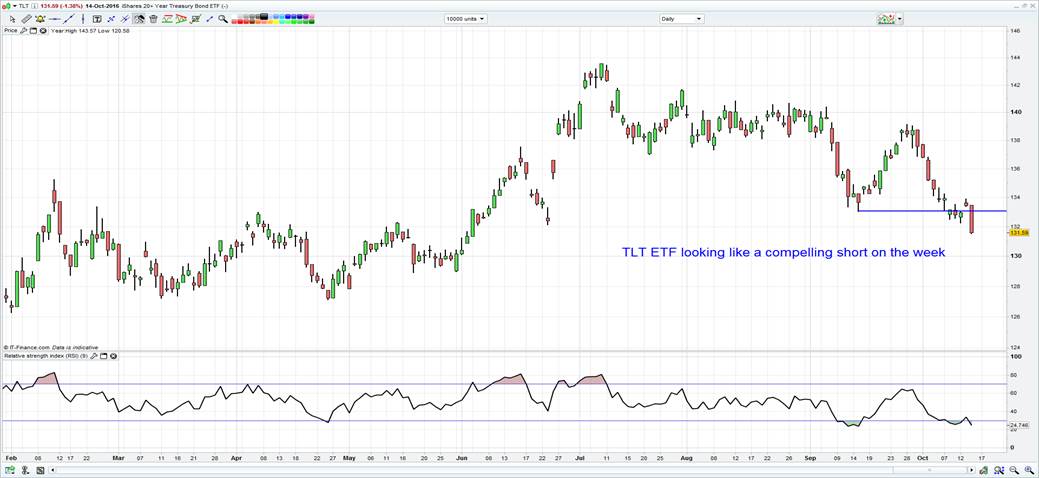
At the same time we have seen further selling of US treasuries, notably on Friday with the 10-year treasury closing at the highest level since 3 June, spurred on by a strong sell-off in UK gilts. The iShares 20+ Year Treasury Bond (NASDAQ:TLT) looks like a compelling momentum short given Friday’s technical break – see chart below. Oil has fallen a touch on Friday, largely as a result of the stronger USD, while the AUD looks like a pillar of strength relatively speaking, helped by solid buying in iron ore futures (+2.5% on Friday).

Asia eyeing a flat start to the week
The leads for today’s Asian session are fairly sanguine and our call is for a flat open in Australia, Japan and Hong Kong. China should find modest support, although all eyes fall on Wednesdays data dump with September industrial production (consensus +6.4%), retail sales (+10.7%), fixed asset investment (+8.2%) and Q3 GDP in play.
Q3 GDP is expected to remain unchanged at 6.7%, with the economist’s estimates ranging from 6.9% to 6.4%. One suspects these numbers will largely be in-line, so the focus should be on the yuan, where it wouldn’t be a huge surprise to see another weakening of the currency this morning given the USD strength on Friday, potentially pushing the CNY to a new six-year low.
It’s interesting to see that despite the CNY weakness, there has been absolutely no effect on the AUD, in fact the AUD (along with the CAD) was the best performer relative to the USD last week. One can also look at the iShares MSCI Emerging Markets (NYSE:EEM) and see that price is consolidating, but hardly rolling over. This seems surprising given the purchasing power for Chinese importers is effectively being eroded by the weakening currency.
This week AUD traders will be specifically focused on Thursdays employment data (consensus expects 15,000 net jobs to be created), but it’s worth pointing out that the market is currently pricing in a 14% chance of a cut from the RBA at the November meeting. This seems fair and when a central bank holds a neutral stance on its policy outlook the speculators will tend to gravitate to other currencies to short such as GBP and now seemingly EUR, JPY and even NZD.
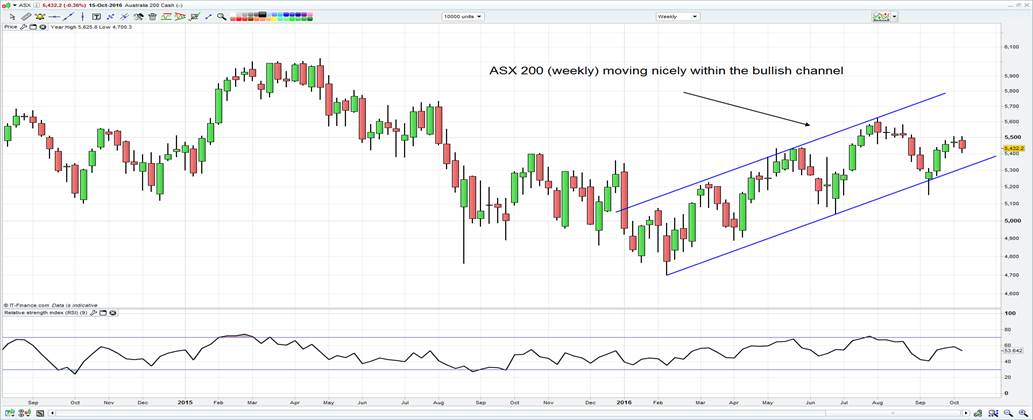
Focusing on the weekly chart of the ASX 200, we can see the index still climbing within a bullish channel, but a weekly close below 5315 changes that picture. One suspects it will be the S&P 500 that plays a greater role on semantics this week, so watch how price reacts into 2,116. A close through here would almost certainly set off a fresh wave of selling in global equities and we got confirmation of the support into 2,116 level on Thursday.
The USD index should drive as well, notably if price can break above the March highs of 9868 and this has been made all the more remarkable, given expectations for a December hike (from the Fed) haven’t really moved from the 65% level for a few days. It seems the sell-off in US fixed income is attracting strong capital flows to the US, but will this USD strength start to act as a new headwind for growth? Consider the Atlanta Fed Q3 GDP model is now at 1.9%, where this was nicely above 3% a few weeks ago.
Of course much fan far will be around Wednesday’s (Thursday 12:00 pm AEDT) third presidential debate, but from a markets perspective I am not sure what more we can learn from it and it promises to be another very ugly and personal affair.

