Major stock indices at new all-time highs
The DJIA and the S&P 500 closed at new All-Time Highs again last week, up ~10.5% from their March lows. This is the 8th time this year that these indices have closed the week at new All-Time Highs. Earnings season starts next week.
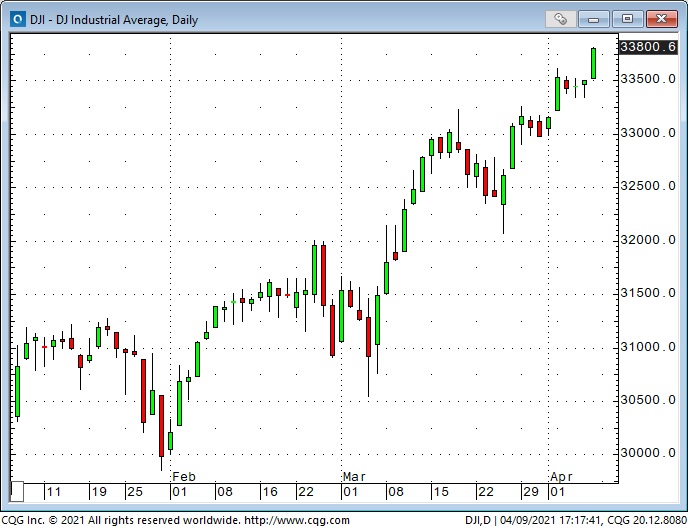
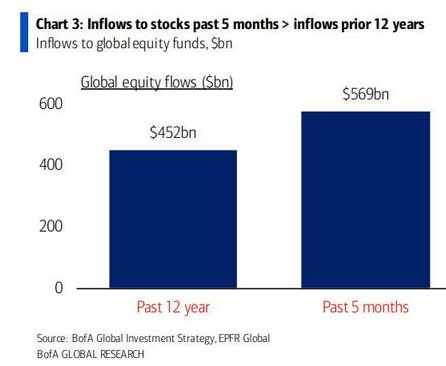
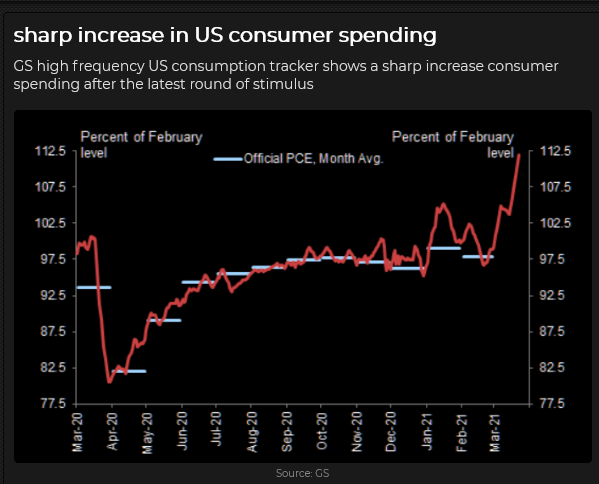
The indices have been boosted by MASSIVE capital flows, stimulative fiscal and monetary policies, and hopes that the re-opening will unleash a surge of pent-up demand. Trading volumes both last week and the previous week have been low.
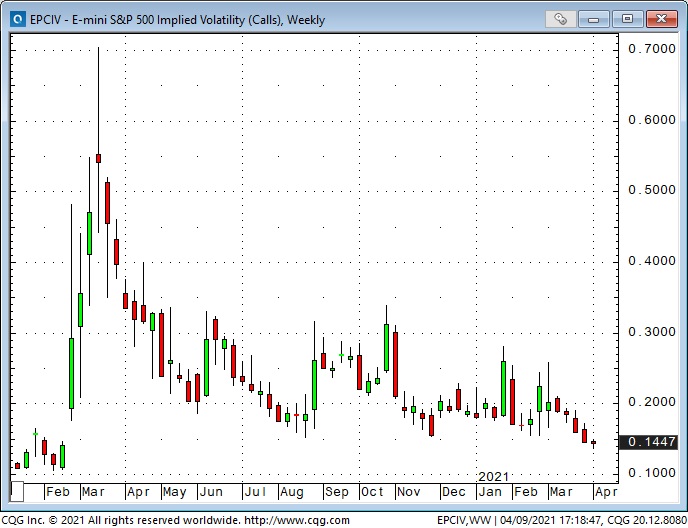
Option volatility: lowest in over a year
As the DJIA rallied 3,000 points the last five weeks, option VOL trended relentlessly lower—perhaps a sign of complacency/optimism that the new “Roaring 20s” is unfolding as it should.
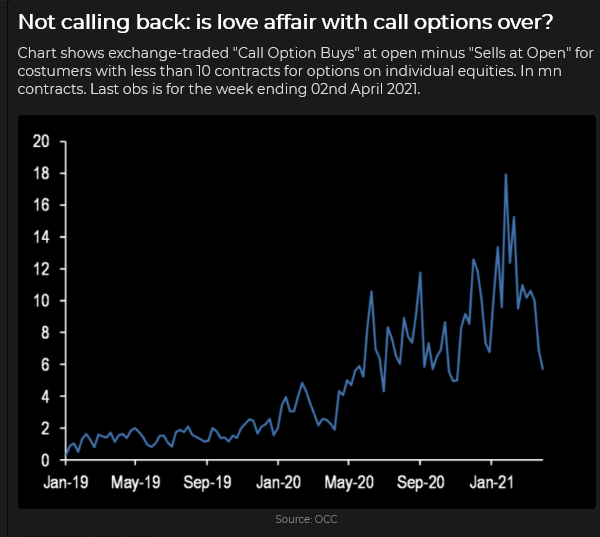
Call option volume is down sharply from the records made in January (when Retail was buying aggressively).
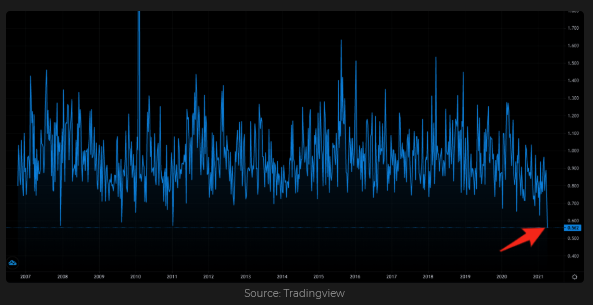
The put/call ratio was at multi-year lows even as call volumes were down sharply—apparently, nobody has any need or interest in buying puts—because stocks only go UP!
US dollar: slightly weaker after hitting 5-month highs
The US Dollar Index (USDX) hit a 30-month low in early January after falling ~13% from the highs made during the virus panic last March. Most analysts were resolutely bearish the USD at the end of 2020, and futures traders held record-sized net short speculative positions against the USD.
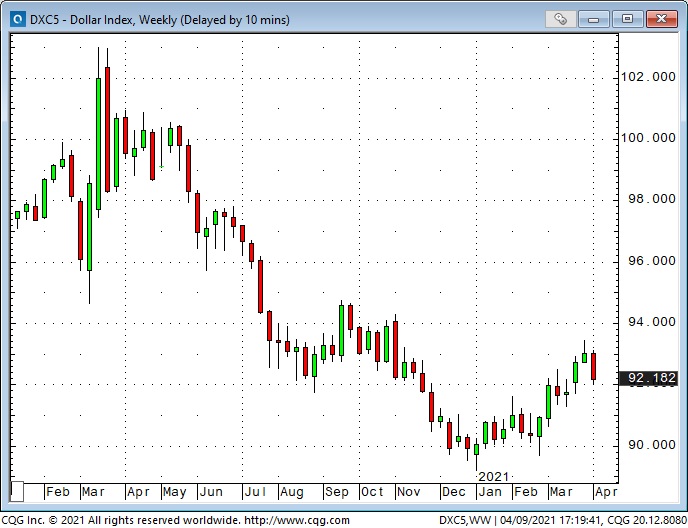
I have previously referred to the storming of the Capitol Building in DC as an “inflection point” for the USD. (I also wrote that over the past 40 years the USDX has frequently made significant turning points around the turn of the year.) As the USDX rallied from its January lows, futures traders have covered most of their net short positions.
The Canadian dollar: down from 3-year highs
The CAD, unlike most other currencies, has rallied against the USD this year, hitting a 3-year high in mid-March. The CAD has benefited from the pro-risk sentiment that has driven the bullish trends in equity and commodity markets.
Gold: the flip-side of the US dollar
Gold made its high for the year in early January on the same day the USDX made its low—and gold turned higher at the end of March on the same day the USDX turned down from its YTD high.
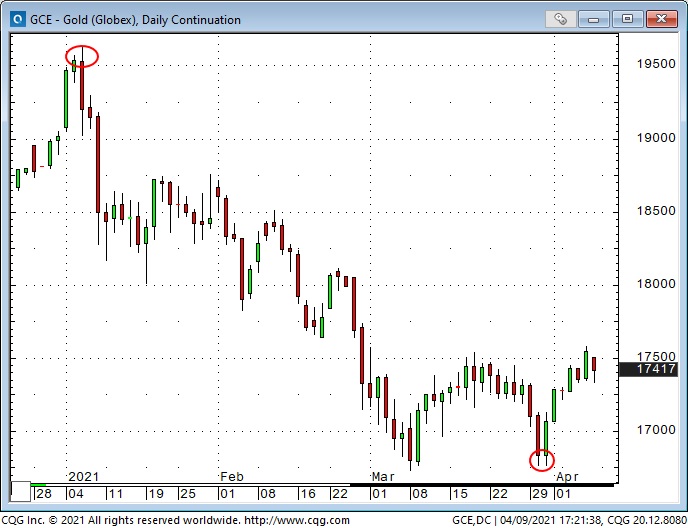
Gold may have put in a classic double-bottom in March after being ignored for several months despite rising inflation expectations.
Since November, the gold ETF market has been hit with relentless selling (although the USD value of total gold ETF assets is only down ~2% from last year’s record highs.) COMEX open interest has declined ~20% since December. Current speculative gold futures positioning remains net-long but is similar to July 2019, when gold was ~$300 cheaper than it is now.
Crude oil: possible top after doubling since November
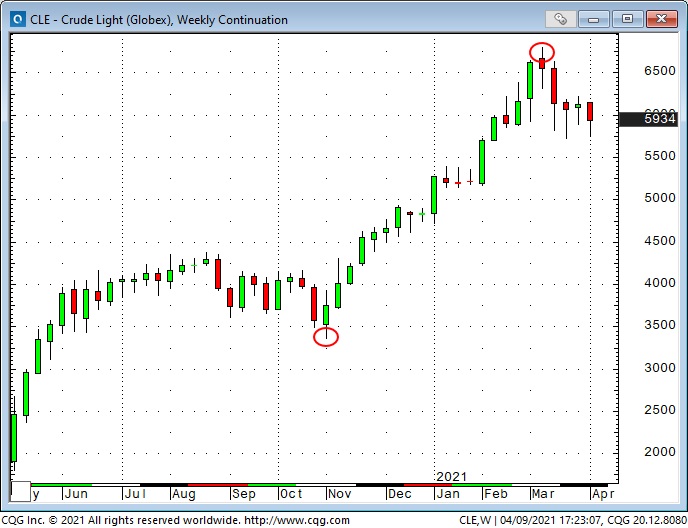
The price of WTI doubled in a spectacular rally from November to March, as hot money aggressively surged into the “energy space” in anticipation of strong re-opening demand.
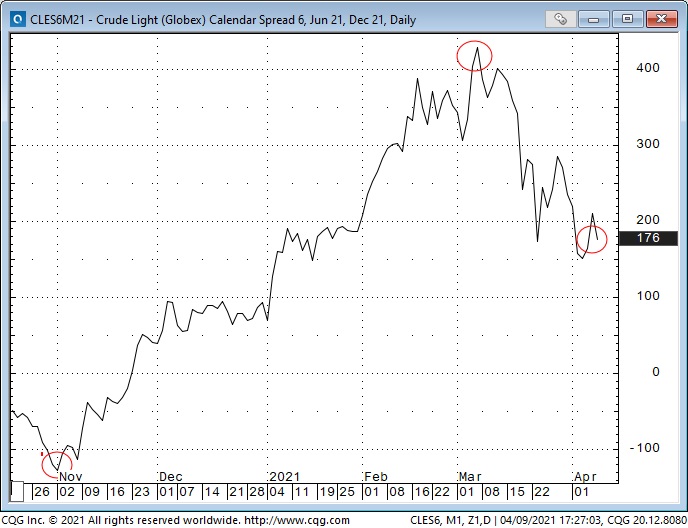
One of the consequences of the speculative surge (open interest increased ~25% from November to March) was a HUGE steepening of the WTI backwardation curve. In this chart, the June 2021 contract was ~$1.50 discount to the December 2021 contract last November—by early March, June was around a $4.50 premium. Since that March high, the premium has been cut in half.
Bond yields: steady after sharp rise since Christmas
The US bond market had its worst quarter since 1980 as the yield on the 10-year Treasury (which had been ~0.50% last August) surged to ~1.75% in mid-March. (In this chart falling bond prices = rising yields.) I’ve previously noted that a new generation of bond market vigilantes tested the Fed as inflation expectations surged in anticipation of the re-opening.
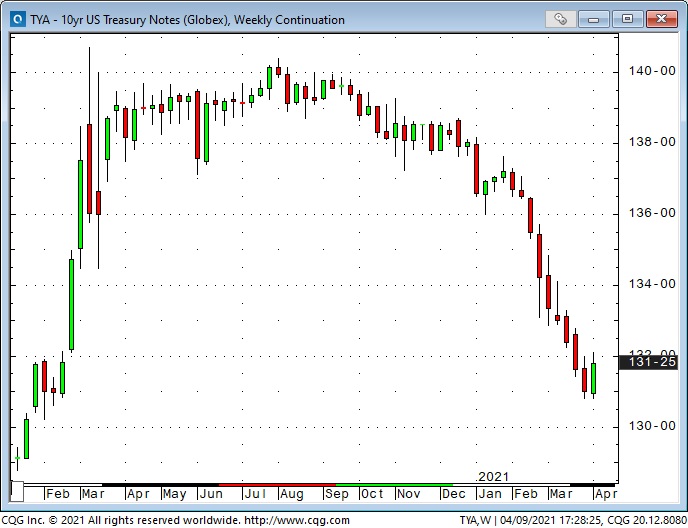
In the past two weeks, the bond market has steadied as several FOMC members, including Fed Chair Jerome Powell, have made it clear that the Fed will react only to “realized outcomes,” not forecasts of what may happen, that the Fed is a long way from achieving (broad-based and inclusive) maximum employment, and that the Fed believes that any inflation spikes will be “transitory.”
My short term trading
My Primary assessment of current market psychology is that a “virtuous circle” of aggressive pro-risk buying has driven asset prices higher, which in turn has encouraged more pro-risk buying. The market is “priced for perfection,” and vulnerable to sharp correction.
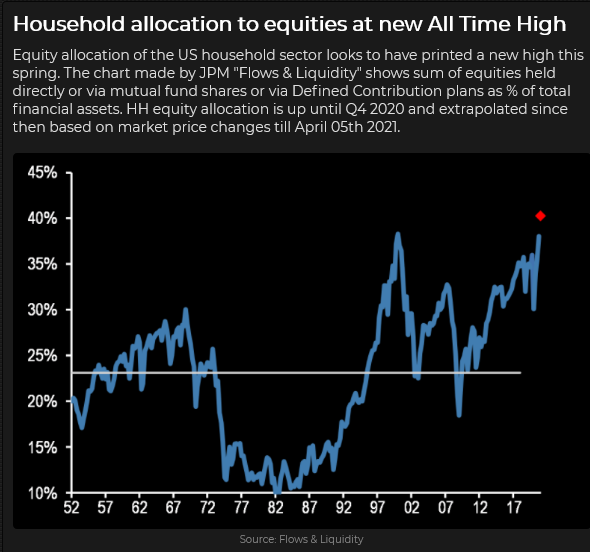
My Alternative assessment is that bullish market psychology may continue to drive risk asset prices higher.
One of my favorite questions is, “What are you going to do when you’re wrong?” I’m wrong a lot, so before I establish any trade I decide exactly what risk management process I’m going to use to protect my capital.
My risk management process acknowledges that my Alternative assessment—not my Primary assessment—may be correct.
Canadian Dollar
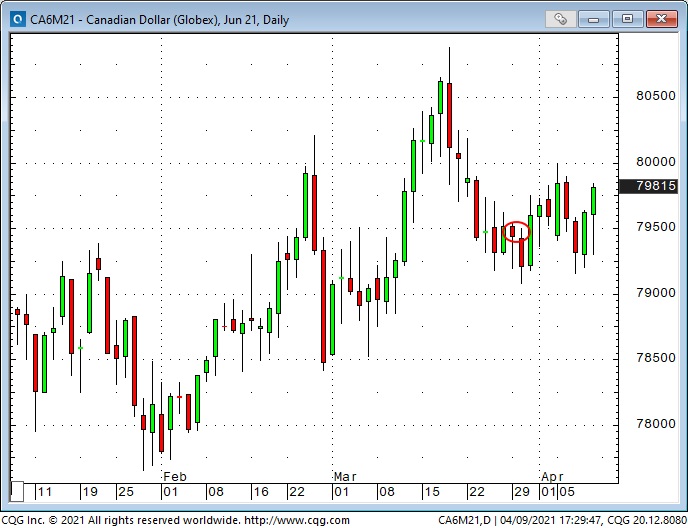
I bought May 79 strike puts on the CAD in late March with the June contract ~7950. The CAD had rallied for months in sync with the commodity indices and had been the strongest commodity currency. Futures market speculative positioning was bullish.
I thought if the CAD fell through 79 cents, it might gain downside momentum. However, the market has moved quietly sideways, and half of the option premium has evaporated. If the CAD closes above 80 cents, I’ll throw in the towel.
Russell small cap index
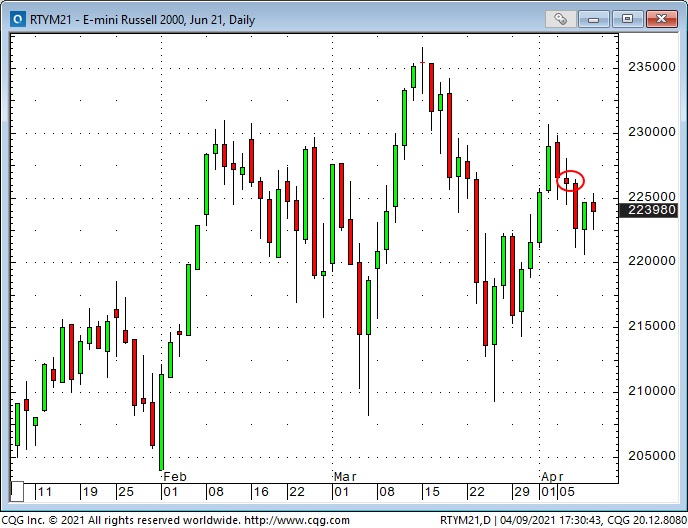
I shorted the Russell Tuesday around 2250 when it traded below Monday’s opening. The Russell had been the strongest of the main stock indices from November through February/March but has been the weakest index since then. I think the equity markets are at risk of a correction and the Russell, being the weakest index, is the best one to short. My stops are below the April highs.
The S&P 500 index
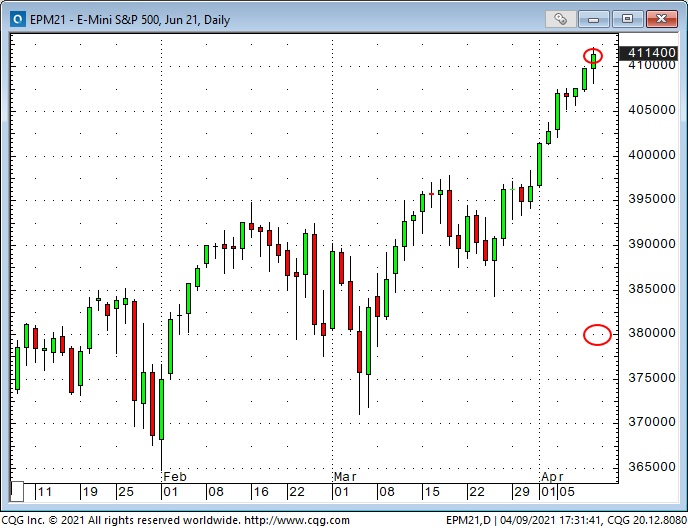
I bought longer-dated 3800 strike puts Friday with the June contract around 4105. Option VOL is at more than a 1-year low. The Put/Call ratio is at a 13 year low. Everybody is bullish. Nobody wants puts. So I bought some.
The Delta is ~15%, so I’m buying a cheap lottery ticket. If the market turns down as it did in January, February and March, I’ll make some money. If the market gets hit with a big correction, I’ll make a lot of money! If the rally keeps going, I’ll lose some money.
Crude Oil
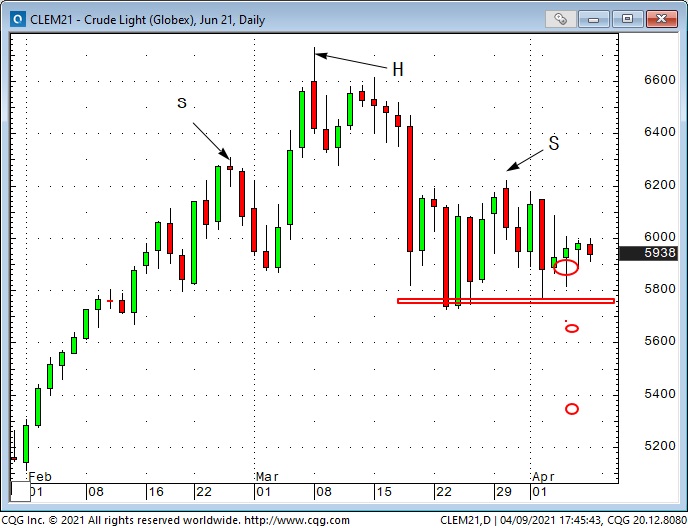
Front-month WTI hit a 30-month high in early March, had a sharp breakdown in mid-March and has chopped sideways since – creating a possible H&S topping pattern. I think if WTI drops through the 57.50 lows, it could skid down towards $52.
On Thursday I bought longer-dated put spreads (long 56.50 strikes / short 53.50 strikes) with June ~$58.50. My net Delta is around 15%. The put spread is a much lower risk play than shorting WTI and gives me the ability to sit through short-term choppy price action. The spread limits my max win if WTI really tumbles, but I’m still looking at a possible 3-to-1 risk/reward.
On my radar
In-line with my Primary assessment noted above I will be looking to pounce if/when pro-risk markets start to crack.
Which stock should you buy in your very next trade?
With valuations skyrocketing in 2024, many investors are uneasy putting more money into stocks. Unsure where to invest next? Get access to our proven portfolios and discover high-potential opportunities.
In 2024 alone, ProPicks AI identified 2 stocks that surged over 150%, 4 additional stocks that leaped over 30%, and 3 more that climbed over 25%. That's an impressive track record.
With portfolios tailored for Dow stocks, S&P stocks, Tech stocks, and Mid Cap stocks, you can explore various wealth-building strategies.
