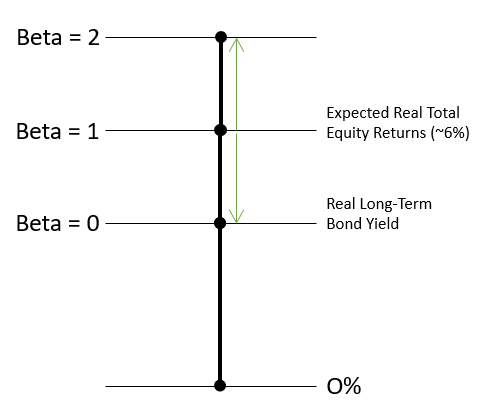
The Capital Asset Pricing Model (CAPM) is a simple heuristic for thinking about market returns. Basically, the idea is that the main risk that you can’t diversify away from is collective business cycle risk, and so that is the risk that investors get paid to hold. “Beta” is the name for that risk sensitivity. In broad terms, in a broad market contraction of -20%, an equity with a beta of 0.5 will go down 10%, a beta of 1 will go down 20%, and a beta of 1.5 will go down 30%. A beta of zero will not lose value at all. Bonds have a beta of zero because the returns are set by contract and do not change except by defaulting.
A diversified basket of equities has a beta of 1. Here’s the basic equation.
ERi = Rf + βi (ERm − Rf)
where: ERi=expected return of investment
Rf=risk-free rate
βi=beta of the investment
(ERm−Rf)=market risk premium
For simplicity, assume no inflation. Basically, the real yield on long-term treasuries is Rf. The expected return on equities is ERi, which is the risk-free rate plus the premium investors demand in order to hold the diversified basket of equities.
We can only infer the risk premium from market prices and by guessing at growth expectations.

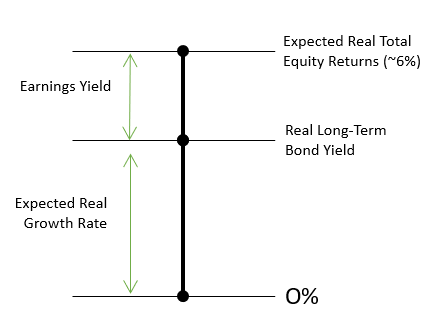
I follow what I call the “Upside Down CAPM” because, in practice, it appears to me that the expected total returns on equities have a very strong reversion to a mean value of about 6%. In other words, at any given point in time, the expected return on equities is unrelated to bond yields. When real bond yields are 2%, the equity risk premium strongly tends toward 4%. When real bond yields are 4%, the equity risk premium strongly tends toward 2%.
That doesn’t mean that equity prices don’t change. They can change for 2 reasons. First, earnings can change. Most contractions in the stock market are related to a decline in earnings, or in expected earnings.
Second, growth rates can change. Long-term bond yields tend to reflect expectations of long-term growth. When long-term growth increases, everyone is better off. And, according to the “Upside Down CAPM”, if total real returns to equity tend to stay at 6%, then when growth expectations and bond yields rise, the earnings yield declines. The price/earnings ratio is the inverse of the earnings yield. High growth expectations lead to higher price/earnings ratios.
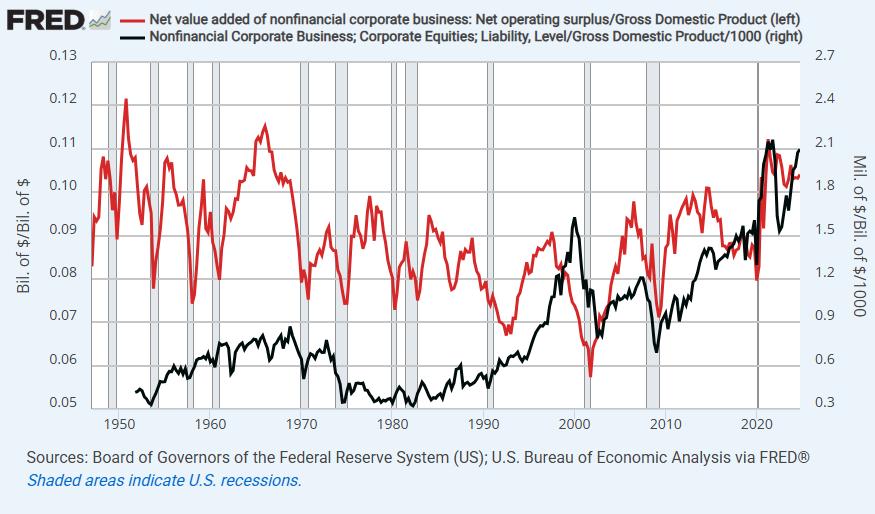
You can really see that in the late 1990s. That market boom was related to rising growth expectations. Prices were rising while earnings were declining. (Figure 3. Corporate profits in red/left axis. Corporate equity value in black/right axis. Note: Most of the upward drift in equity value is due to the increasingly global reach of revenues and profits, so that US GDP is not actually a fitting denominator to use.
That is also the source of our trade deficit. We have provided the at-risk capital for a lot of international production, and we use the profits from that capital to buy imports. It is perfectly sustainable, and, in fact is a consequence of being awesome. That’s just one of a thousand reasons the trade war is dumb. It’s so dumb it’s hardly worth analyzing, except to prepare for the dumb consequences.)
I suppose those trends match an Austrian misallocation / Minsky cycle type of theory. The question is whether the growth expectations are legitimate or not. There is probably a bit of both - real growth potential or cyclical overreach - at any given time. In either case, the Upside-Down CAPM says that market prices tend to reflect stable expected returns on equities.
It is better for everyone if those returns come from growth rather than earnings. Broad-based progress will tend to be associated with high real bond yields and a low equity risk premium. (Another dumb part of the Trump administration's motives. Low interest rates reflect failure. Again, too dumb to discuss much, but worth planning for lower growth if that is what the administration is aiming for, whether they know it or not.)
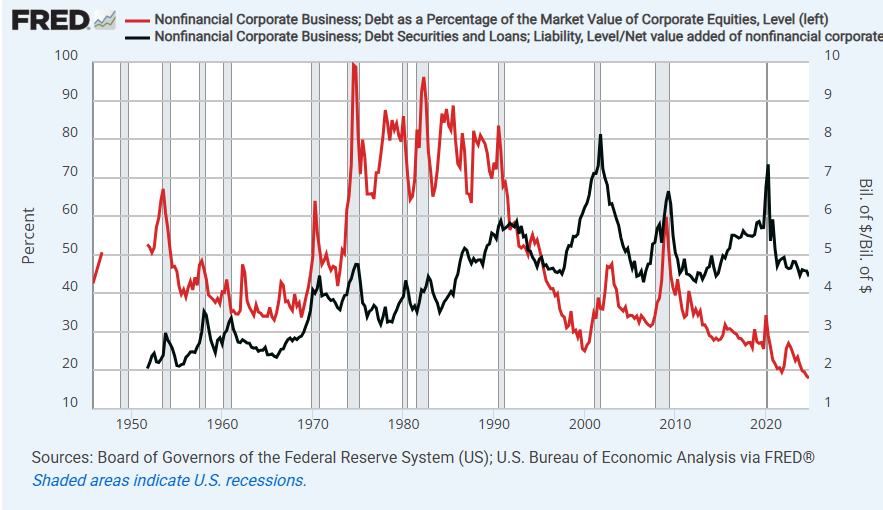
Figure 4 shows corporate debt as a ratio with corporate equity values (red, left) and corporate debt as a multiple of operating profits (black, right). Again, here, there is a global vs. domestic issue with the data. The profit here is domestic, whereas the equity and the debt could be supported by global operations.
So, debt/global profit has likely been declining. My point here is that debt has been flat or declining for decades, and the cyclical fluctuations are driven more by changing profit and equity values than by debt levels.
To my eye, the historical record here clearly does not support a model of a market that feasts on low interest rates to fund unsustainable malinvestment. The new corporate giants are net creditors, in fact. Debt is mostly a market with relatively stable quantity, and the price (yield) is driven by sentiment and expectations.
Low risk debt is a service provided by the borrowers (institutions with a safe base of collateral) to the lenders (savers seeking risk-free deferred consumption). And when demand for deferred consumption is high, then yields are low, at-risk investment declines, growth declines, and equity holders still get their 6% returns, but more of it comes from profits rather than from future shared growth.
Anyway, my motive here in running through my Upside Down CAPM model again is to set up a discussion of what this means for the housing market in the year 2025 as we bumble our way through a dumb recession.
I don’t feel as confident about the road ahead as I usually do because dumb isn’t easily predicted, but I think there are things to be learned by thinking about housing with this model in our current context.
