Chinese RMB hits 3-year high vs. the USD
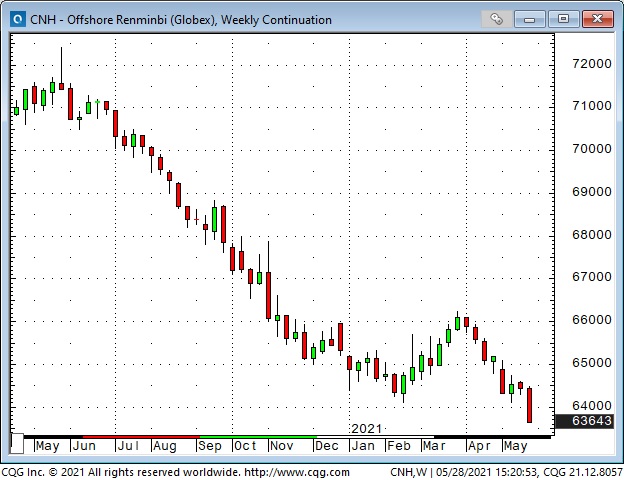
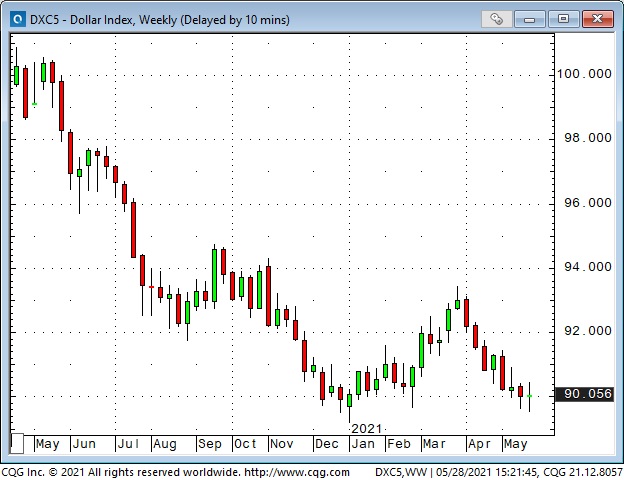
The Chinese RMB rose nearly 4% against the US dollar in the last two months—closing last week at a 3-year high. Some analysts believe the rally in the RMB was “engineered” by the Chinese government ahead of trade talks with the USA; however, the USD has been weak against nearly all actively traded currencies, with the US Dollar Index (USDX) falling ~4% since the end of March. (In this chart, falling prices = fewer RMB needed to buy one USD.)
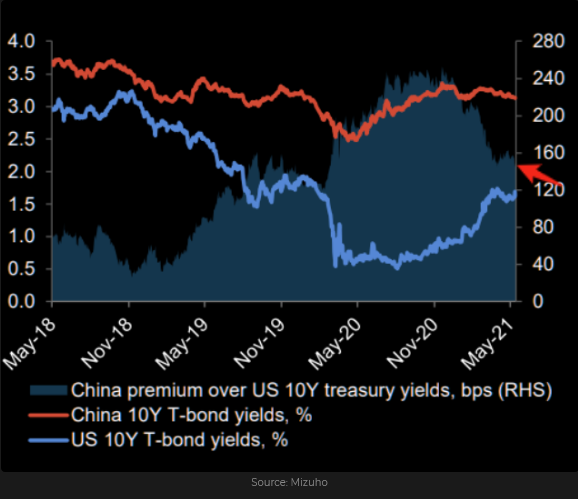
Interest rate premiums often support or boost one currency against another. Chinese 10-Year bonds currently offer a ~1.5% yield premium over US 10-year Treasuries.
The Chinese “crackdown” on crypto, their threats against commodity speculation, and their tightening of monetary policy have impacted international markets even as anti-Chinese sentiment gains stronger bipartisan support in Washington—but—the RMB rally is only keeping pace with the strength of most currencies vs. the USD.
This chart shows the US Dollar Index is back near the 3-year lows it hit in early January.
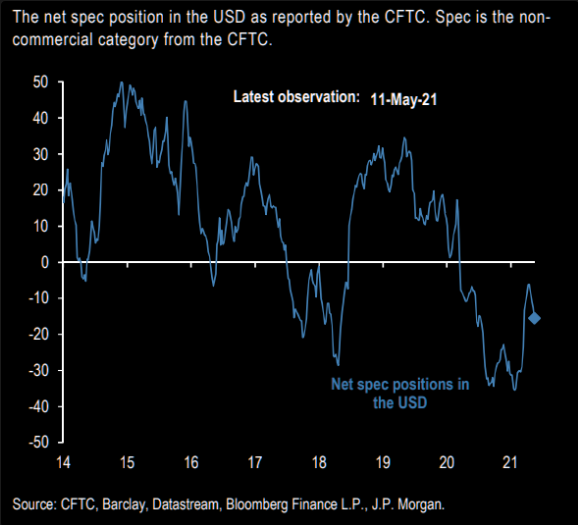
This chart shows that net speculative short positions against the USD in the futures market hit a multi-year high in January 2021—fell back toward neutral as the USD rallied January to April, but have been building the past two months. The consensus is that the USD weakens from here.
The Canadian dollar has been strong
The Canadian dollar was near a 6-year high (up 7% since early February) and has been the world’s strongest currency YTD. The looney hit an 18-year low around 68 cents in March 2020, but has moved steadily higher since then. Its biggest setback was only a 2-cents correction last September.
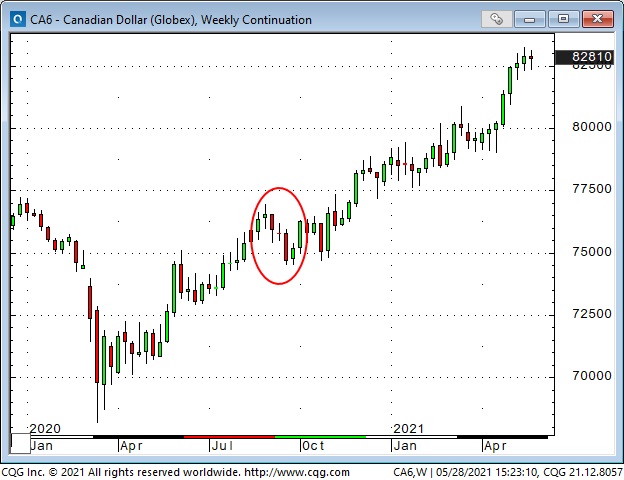
The steady rally in the CAD has been supported by speculative buying—open interest in the futures market is at an All-Time high (ex brief delivery ramps) as speculators see the CAD as another way to play the rising commodity markets.
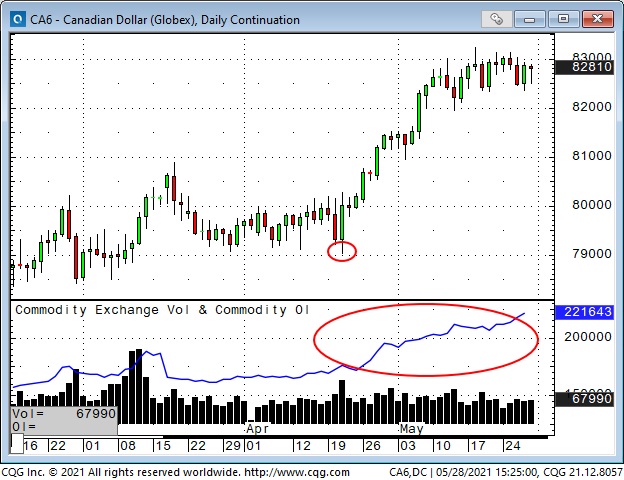
The Bank of Canada surprised the market on Apr. 21 with a more hawkish-than-expected monetary policy statement. Since that surprise, the CAD has rallied over 5%, and open interest has soared ~50,000 contracts, the equivalent of CAD$5 Billion.
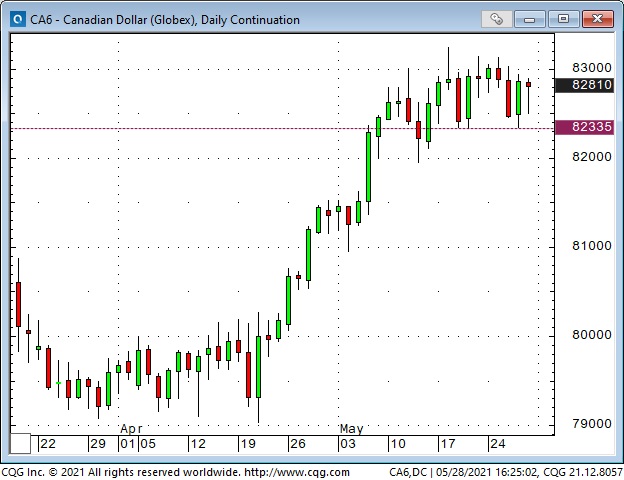
Over the past year, the Canadian dollar rally has been highly correlated with the rallies in stock and commodity markets and the weakness in the US dollar. Recently, I’ve thought that the bullish enthusiasm for the CAD was overdone, and I’ve been trading it from the short side. I currently own 82 strike puts. A break below 8233 could trigger a wave of selling.
The Australian dollar may be at risk of falling
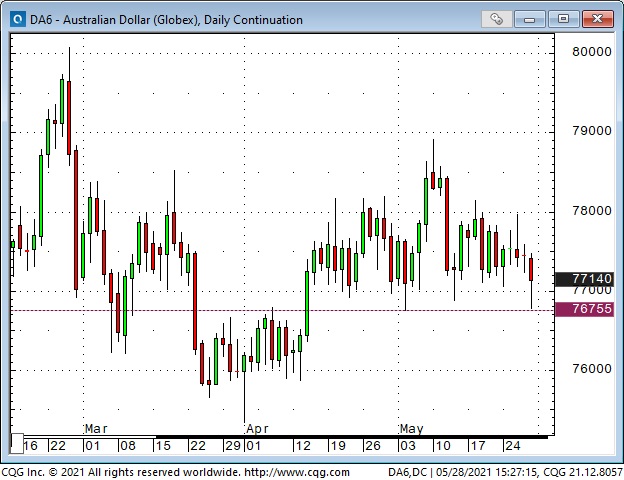
Over the past year, the Australian dollar rally has also been highly correlated with rallies in the stock and commodity markets and weakness in the USD. However, the AUD has been much weaker than the CAD in the past few months (Australia near slowing China—Canada near the booming USA?).
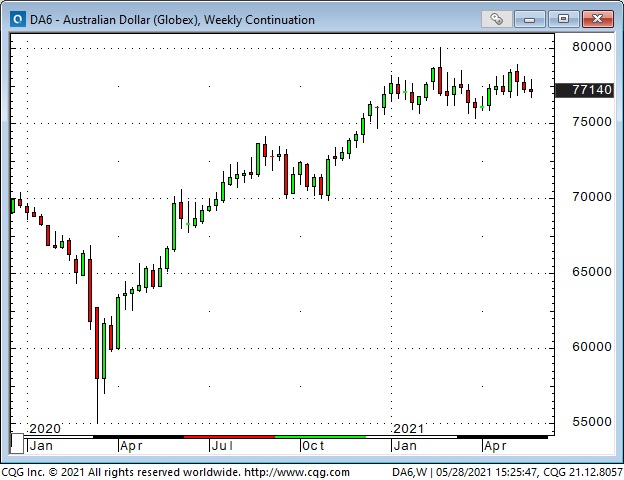
I’ve thought the AUD might be at risk of falling, especially if stocks and commodities weakened and/or the USD rallied. A break below 7675 could set off more selling. I bought AUD puts last week.
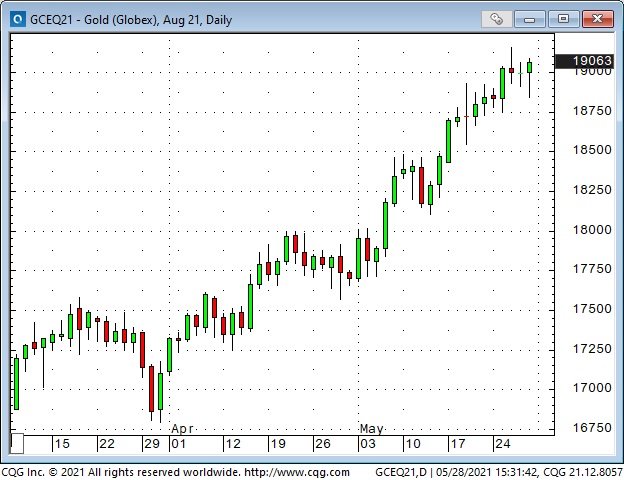
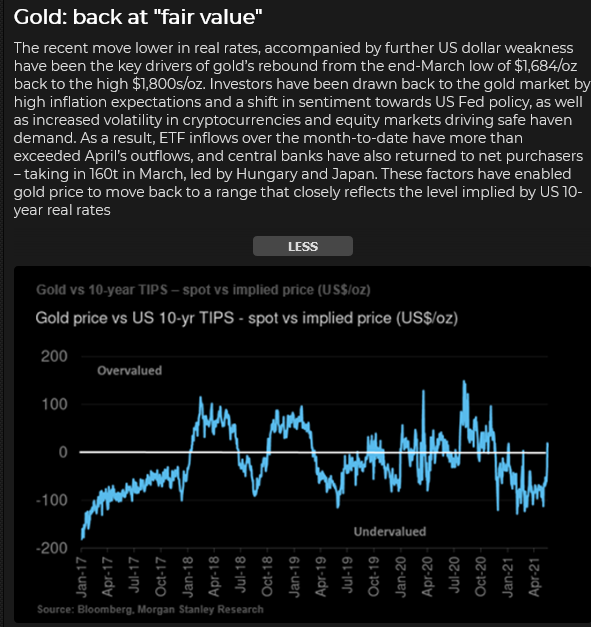
Gold up >$200 from March lows, time for a small correction?
Gold has historically had a strong negative correlation with the USD, and that correlation has been robust this year (YTD, the high for gold and the low for the USDX was Jan. 6, the low for gold and the high for the USDX was Mar. 31.)
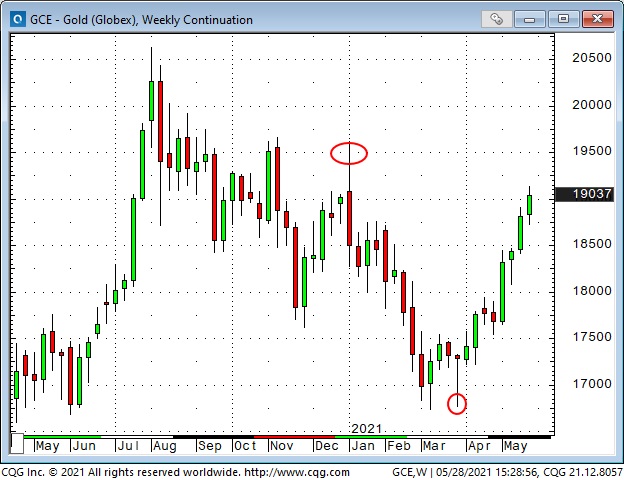
In keeping with my expectation that the USD is due for a bounce, I’ve taken a small short position in gold. I’ve got ~$10 risk on the trade, and if gold weakens from here, I think it could easily slide $50 or more.
Stock indices had a great rally, time for a correction?
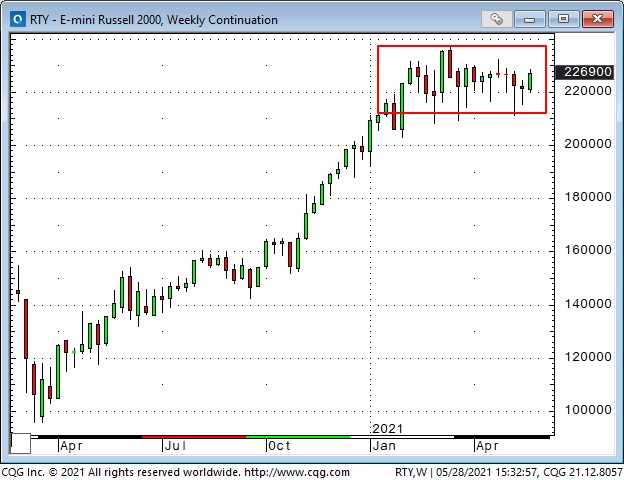
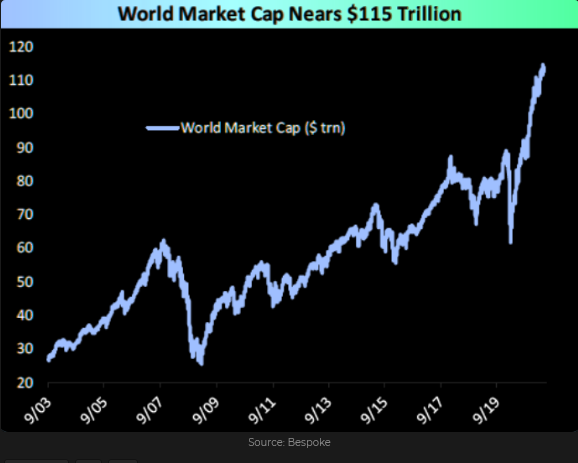
The major American stock indices had a powerful rally from the lows made in March 2020, but recently I’ve thought that a correction is overdue. The small-cap Russell 2000 made its high in March and has been sideways to lower since.
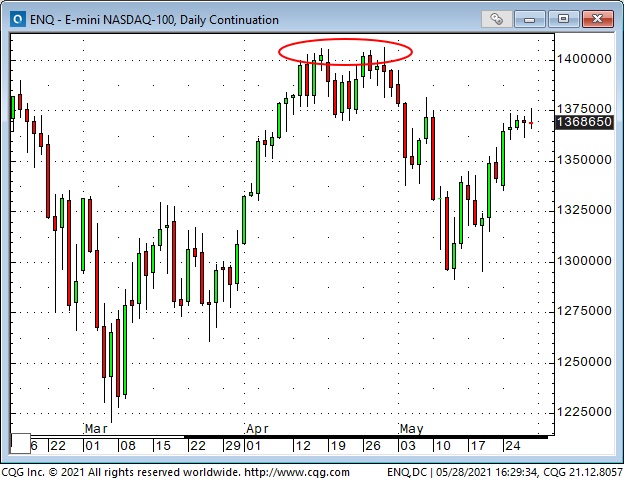
NASDAQ 100 made a double top in April and has stayed below those highs since.
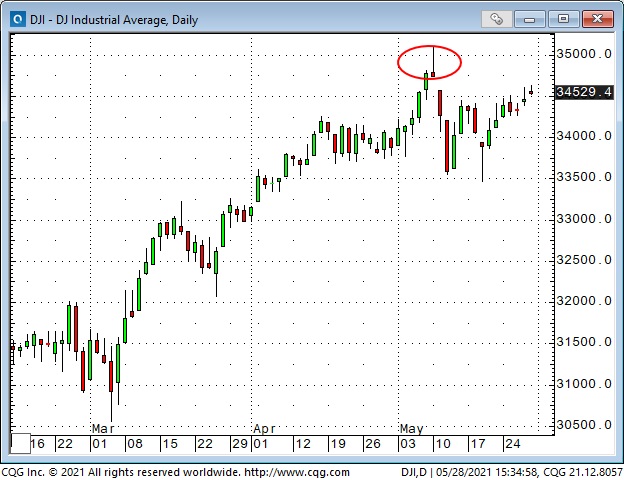
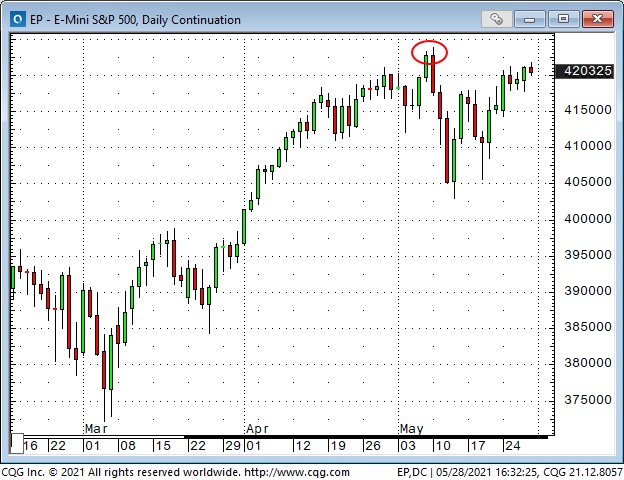
The S&P, the DJIA and the DJT all made record highs on May 10 and have remained below those highs.
I’ve been looking for the S&P to bounce off the May lows and then roll over and make new lows. I was short at the end of last week but was stopped for a small loss Monday. I’m flat going into the long weekend (both the US and the UK are closed Monday, May 31), but I will look to sell weakness in June, especially if the markets roll over without making new highs.
It’s quiet out there Durango—too quiet!
Price action in currencies, equities, interest rates and commodities was relatively quiet last week (ok, copper had a spike). Volumes were relatively low, and option volatility fell. The implied vol on S&P futures dropped to a 14-month low.
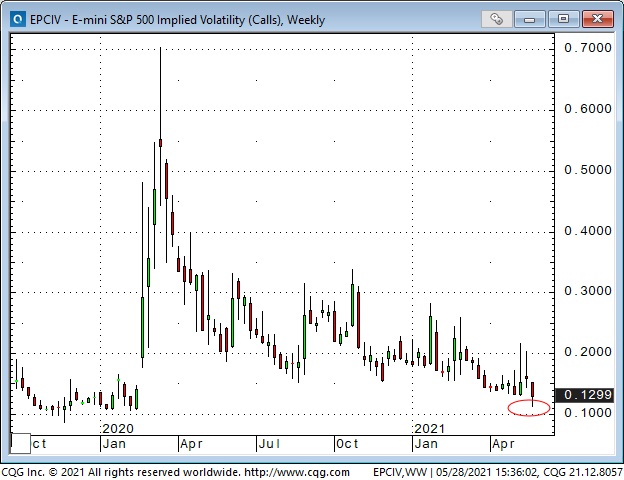
Maybe the “quiet” means complacency. Maybe it was simply people not wanting to do anything ahead of month-end and the long weekend. Or maybe we’ve had the BIG moves, and now market momentum is in neutral.
Waiting for a new narrative to develop.
