Possible major inflection point
The S&P 500 stock index hit All-Time Highs in February 2020, but tumbled ~35% within the next five weeks, as the virus contagion shattered investor confidence.
Central banks and governments launched unprecedented monetary and fiscal stimulus to counteract the effects of the virus, and the S&P roared back from the March lows to make new All-Time highs by August.
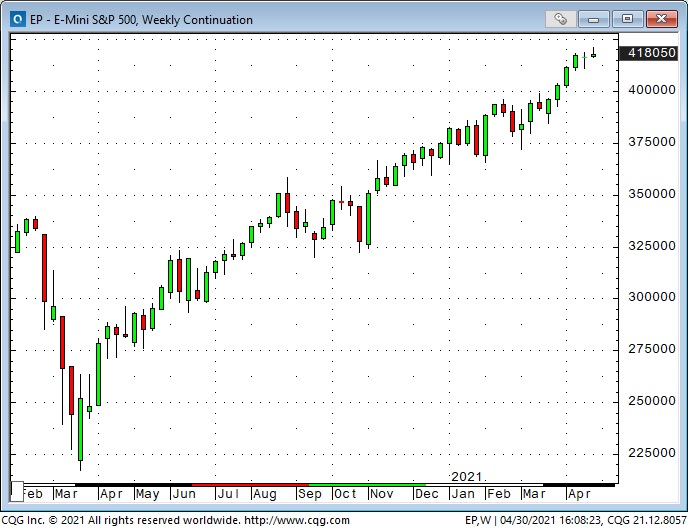
For the next ten weeks, the index drifted sideways, correcting ~10%, and then in early November, Joseph Biden was elected, Pfizer (NYSE:PFE) announced a vaccine, and the market rally resumed with a vengeance.
At the end of April 2021, the S&P and the DJIA were up ~90% from last year’s panic lows, the NASDAQ was up ~112%, and the small-cap Russell was up ~140%.
The bullish news just keeps coming
This week the Fed confirmed that they would maintain their ultra-dovish policies. Biden introduced plans for yet another massive stimulus package. Corporate earnings reports were stronger than expected (with major buy-backs announced), key economic reports were strong, and re-opening enthusiasm grew as the vaccine rollout continued apace.
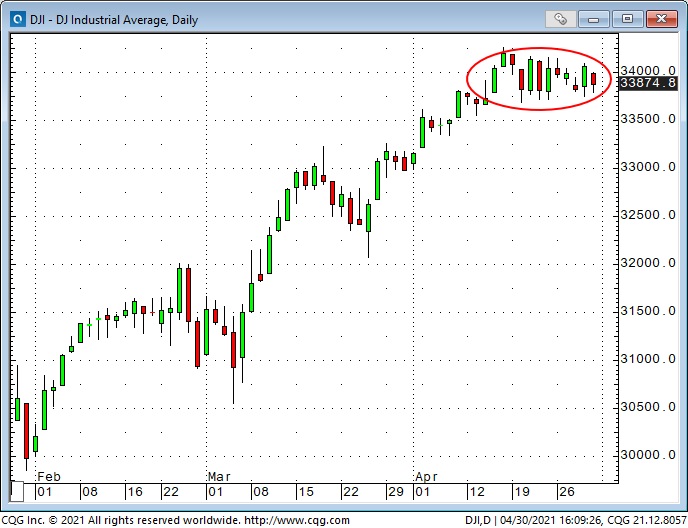
But the DJIA has drifted sideways since mid-April. Sell in May and go away?
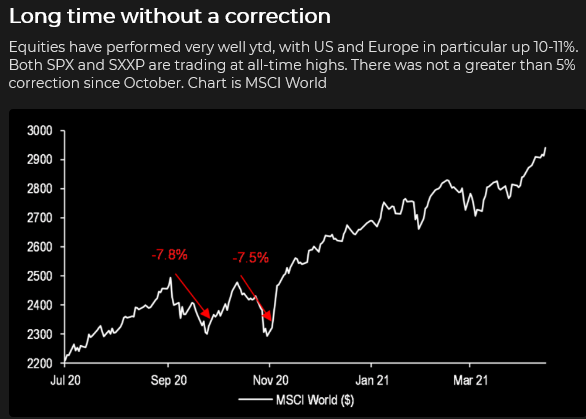
What could spoil the mood?
The market does have several issues to be concerned about: Biden is taking a more left-of-center course than expected with his tax increase and “nanny-state” proposals, the Fed appears to be willfully blind to the inflationary consequences of their policies, with supply shortages are showing up everywhere from basic food supplies to computer chips.
The virus may not be going away quietly, there are probably more over-levered disasters lurking in the financial markets, and then, of course, there are the geopolitical flashpoints that may suddenly introduce today’s complacent yet over-extended markets to an existential level of uncertainty.
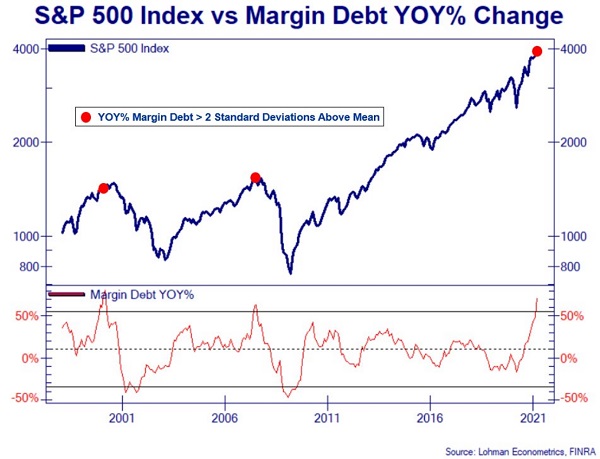
I remain skeptical of the bullish enthusiasm
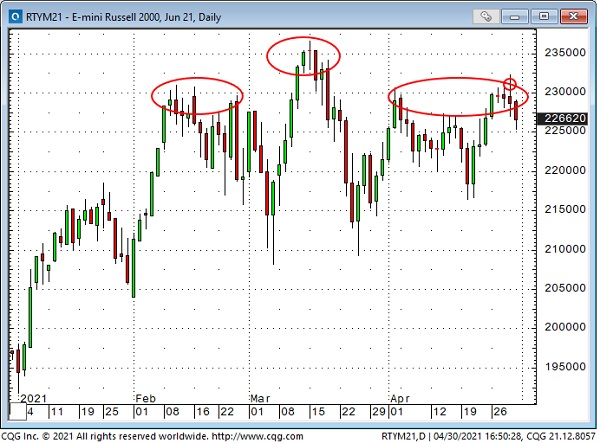
I continue to think that bullish enthusiasm for stocks and commodities is WAY over the top, and the market is at risk of (at least) a correction. I still own a small put position in the S&P, and I shorted the Russell on Thursday (small circle within the right shoulder circle) after it opened higher following Biden’s Wednesday night speech but then quickly turned lower.
The Russell has been the weakest of the major indices the past six weeks— if I want to short stock indices, I want to short the weakest one. The Russell could also be forming a Head And Shoulders top since February—if it breaks the neckline around 2100, the target is around 1850. If this market develops any downside momentum, I will try to add to my short position.
The U.S. dollar
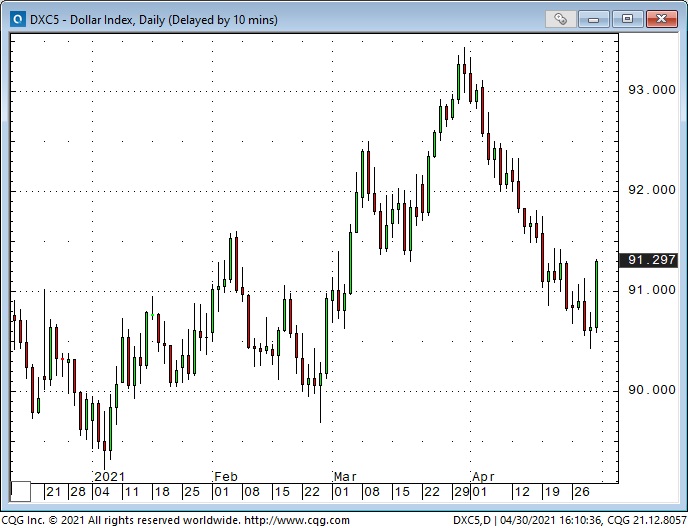
The US Dollar Index rose ~5% from 33-month lows in early January to the end of March. It fell back ~3% in April but had a strong reversal at the end of the month. I’m inclined to be bullish on the USD.
The Canadian dollar
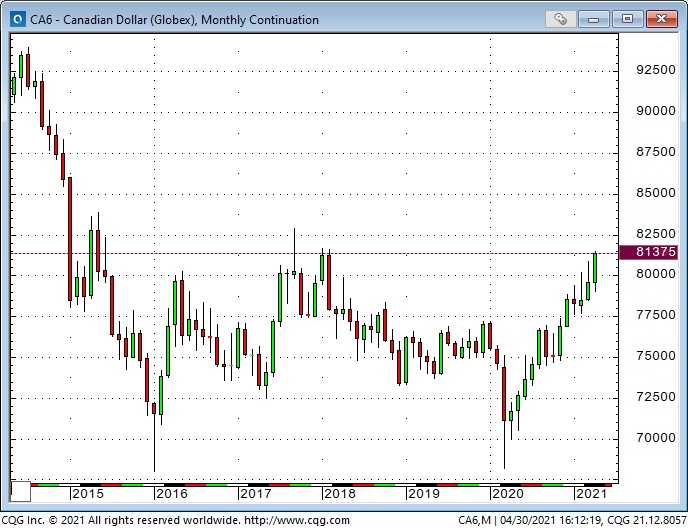
The Canadian dollar (CAD) has been the strongest of the major currencies over the past several months and closed April at its highest monthly close against the US dollar in six years—highest weekly close in over three years—up 16 cents (~19%) from the lows made last March.
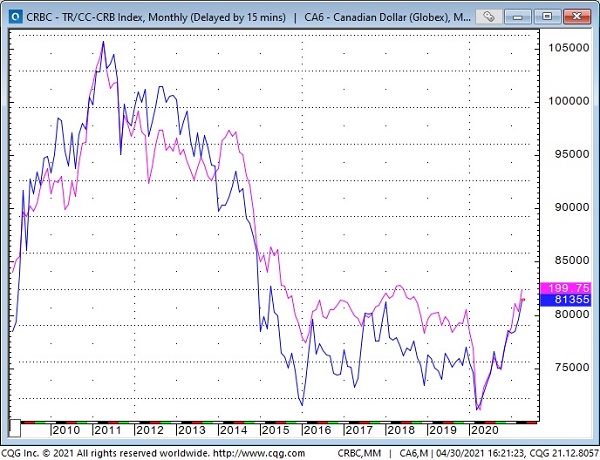
Over a multi-year period, the CAD has been highly correlated with the major commodity indices. The CRB Commodity Index has doubled from last year’s lows and has helped boost the CAD. (In this chart, the CAD is the blue line, the CRB Index is the pink line.)
The CAD is also strongly influenced by the relative strength of the USD. If the USD is weak against most currencies, as it was from March to December last year, the CAD will usually rise. The CAD is also strongly influenced by the relative strength of the US stock market—a rising US stock market, as we’ve seen since last March, usually means a stronger CAD.
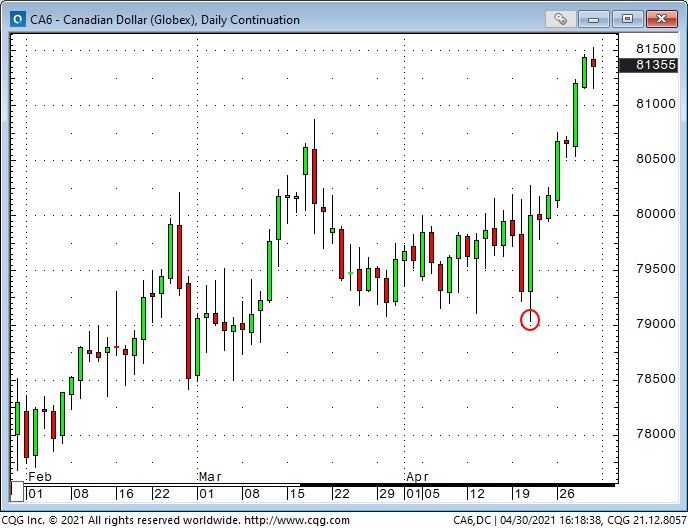
Last week the CAD rallied hard off 6-week lows when the Bank of Canada was much more hawkish than expected. (Red circle marks where the CAD was just before the BoC announcement.) The rally continued last week as the USD was softer, the stock market was steady, and commodities surged higher.
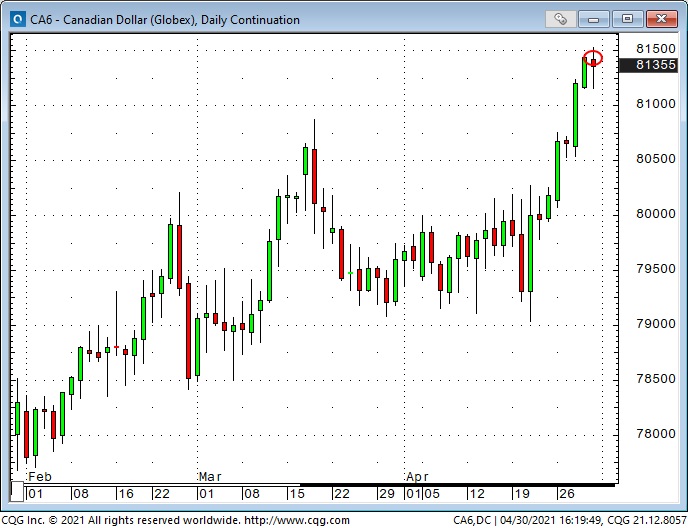
In the “On My Radar” section of last week’s notes, I wrote that I would be looking for an opportunity to re-short the CAD. I sold it short Thursday when I shorted the Russell, but the market hit my tight stop. I re-shorted it Friday (red circle) and maintained that position into the weekend.
Lumber continues to soar
Front-month lumber futures fell nearly in half during the virus panic in February/March of last year—but lumber has rallied 6X from those lows to April’s All-Time High close— rising from ~$250 to $1,500.
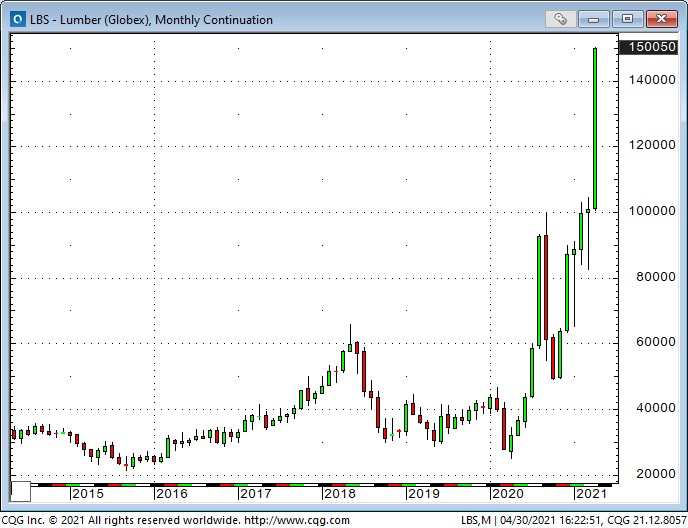
The lumber futures contract specs are 110,000 board feet of random length Spruce-Pine-Fir 2x4s—a typical load for a flatbed 73-foot railroad car. The next time you see one of those roll past, remember you’re looking at ~$165,000 worth of wood!
(Just for fun—if you had a 100 oz. bar of gold—worth about the same amount of money—you could put it in your shirt pocket—assuming the stitching would hold. The bar of gold weighs ~7 pounds.)
Basic food prices are soaring
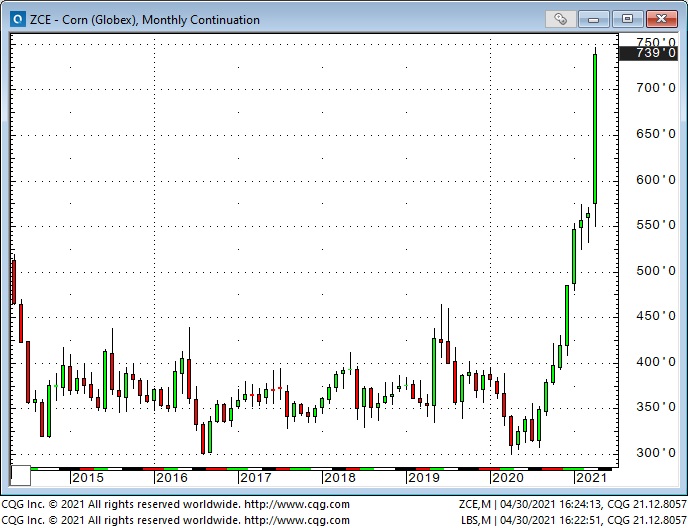
Corn has more than doubled in price from last year’s lows, with the front-month contract now at 8-year highs. The monthly RSI is at a 25-year high.
Ross Clark of Charts and Markets has been a good friend for over 40 years, and he is a highly respected technical analyst. In his Apr. 30 report, he writes:
"Corn has been one of the persistently strong commodities during the last year, with higher lows every month since September. April created a monthly Sequential 9 Sell Setup, last seen around the 2011 and 2008 tops (nine consecutive months with a close above four months earlier).
"This week, it has registered an upside Trifecta; Exhaustion alerts in the daily, weekly and monthly charts. In the last fifty years, this has been rare; June ’08, April ’96, Nov ’80 and Aug ’73."
WTI crude oil rallied on expectations of strong re-opening demand
Three weeks ago, I established a bearish put spread in WTI (long 56.50 puts / short 53.50 puts), looking for WTI to fall through the 57.50 support levels made in March.
As the market rallied the past three weeks, I was grateful I had only a small position with a net 13-delta. If I had been short WTI futures, I would have been stopped out shortly after putting on the trade.
I was using the options strategy to allow myself to stay with the trade for a longer period of time. (See last week’s notes—linked above—where I wrote about trying to lengthen my trading time frame to better match my analysis time frame.)
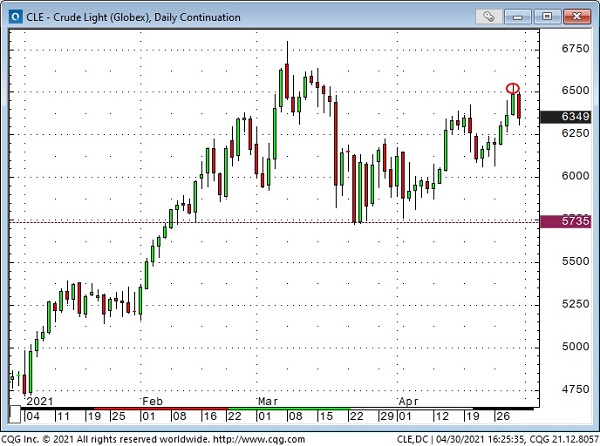
As WTI rallied the past three weeks, the puts fell in value—the gains on the short put partially offset the losses on the long put. On Thursday, when June WTI rallied above $65, I took profits on the short put (red circle) and remain long the 56.50 put.
I’ve got 17 days to option expiry—if WTI falls from here, I may recoup some or all of the unrealized losses I have on the position. (If WTI takes a serious tumble, I might even come out money ahead!)
Copper is inches away from All-Time Highs
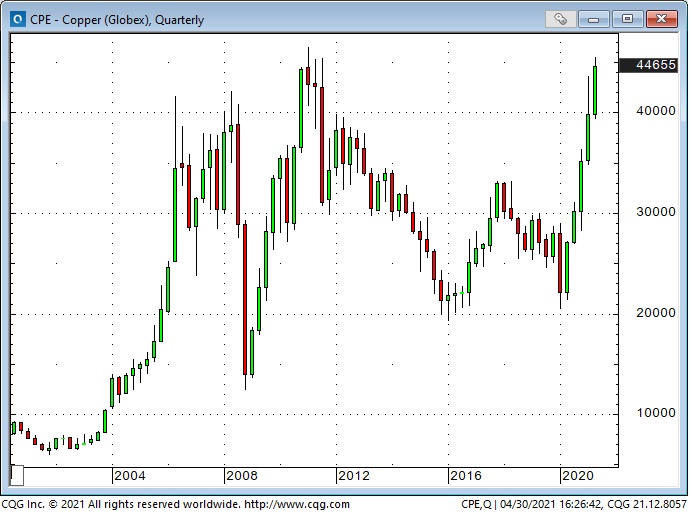
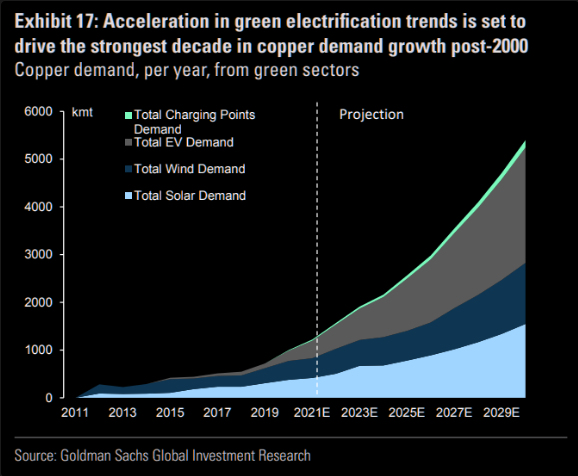
Copper is another commodity that has more than doubled from last year’s lows. The Big Story on copper is that the Green movement to electrification will cause the demand for copper to soar—and it takes years to bring a new mine to production—so supply/demand will be hugely out of balance.
Gold continues to trend lower
Gold in US dollar terms continues to trend lower despite falling real interest rates, a weaker USD, surging commodity indices, the Fed’s clear commitment to maintaining rapid balance sheet growth and ultra-low interest rates.
With Joe Biden’s aggressive fiscal stimulus proposals, rising inflation expectations, the stock market priced to perfection and with deadly serious geopolitical risks looming, gold has been even weaker in terms of other currencies and commodities.
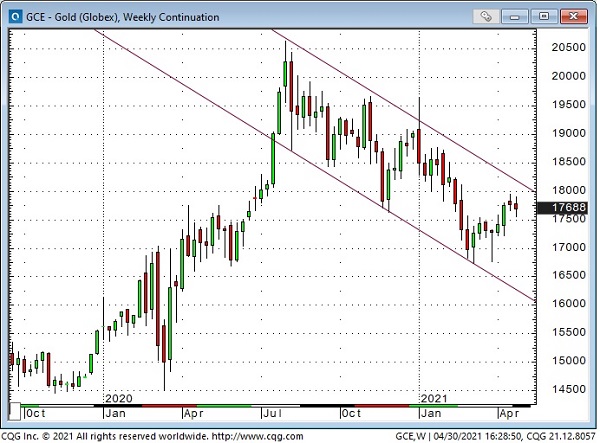
What’s wrong with gold? It’s not going up. People like to buy things that are going up. Gold will probably start going up when other things start going down.
There is No Fear in today’s markets. Gold needs a little Fear. Large gold ETF sales are continuing (130 tonnes in Q4 2020, 178 tonnes in Q1 2021 and ~50 tonnes in the first 3 weeks of April 2021)—and the younger generation seems to be buying crypto—not gold.
My short term trading
I’ve struggled to adapt my market analysis and trading to what may have been a true paradigm shift created by massive gov’t/central bank stimulus—coupled with the global lovefest for Big Government and climate change policies.
I swap emails and talk with other veteran traders—read their websites—and I sense a common theme is a struggle to comprehend the willingness of markets to accept bizarre valuations. As my old friend Bob Hoye likes to say, “People will believe the most preposterous stories as long as the price keeps going up!”
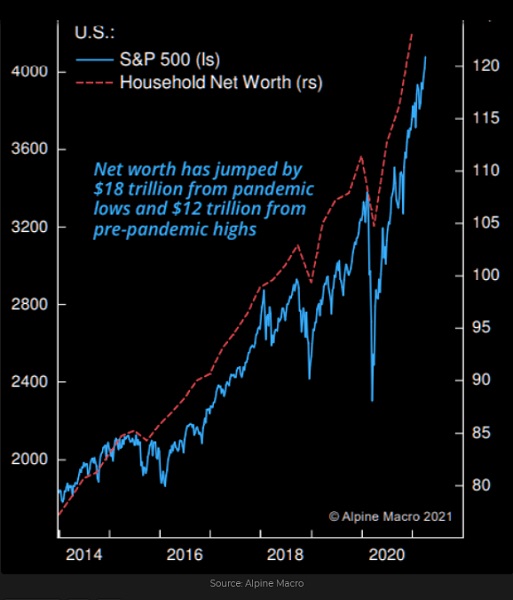
Perhaps I should note that George Soros once said that when he sees a bubble forming, he rushes to buy it, confident that it will only get bigger.
On my radar
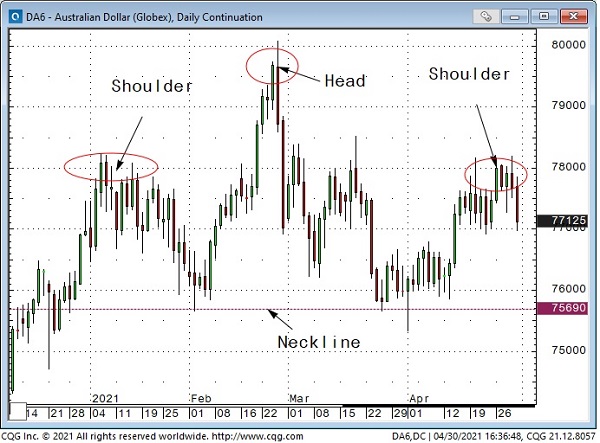
I watch many different futures markets (mostly financial futures, energy and metals), and my experience tells me that there are all kinds of inter-market relationships between different markets. The Australian Dollar (AUD) may have been developing a Head And Shoulders topping pattern since December.
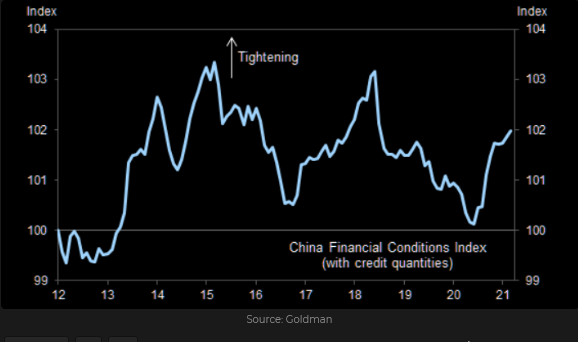
A breakdown in the AUD would “fit” with my notion that commodities are due for a correction, that the Chinese RMB will turn lower against the USD and that the general “bullish enthusiasm” in markets has run too far, too fast.
Note that financial conditions in China are tightening as the authorities try to rein in the economy.
If the AUD does generate a technical breakdown, I hope to take advantage of it, but I will trade it on its own merits (or de-merits.)
In other words, I won’t short it because it “should be” falling because of what is happening in other markets; I’ll short it because it looks like it could take a tumble. A break of the H&S neckline would target a fall to ~72 cents.
Disclaimer: Victor Adair retired from the Canadian brokerage business in 2020 after 44 years and is no longer licensed to provide investment advice. Therefore, this post is not intended to be investment advice for anyone about anything.
