Stock indices soar to new all-time highs, again
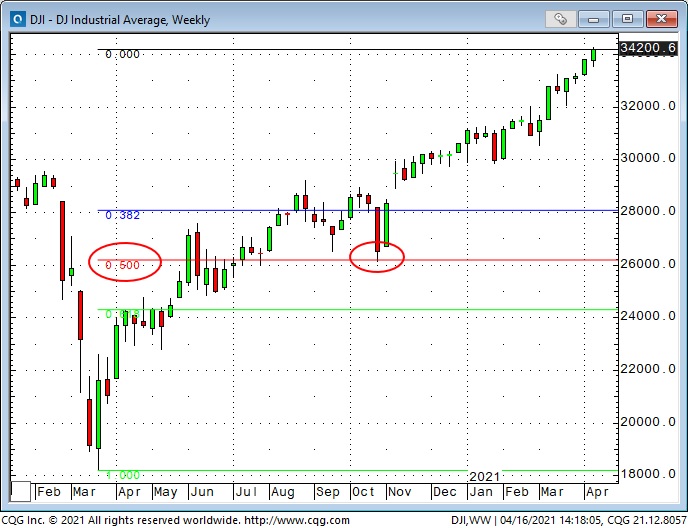
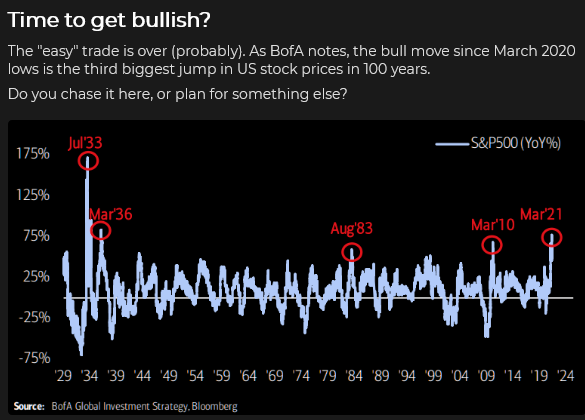
The DJIA rallied ~16,000 points (~90%) in thirteen months from the panic lows last March to last Friday (Apr. 16).
There were two parts to the rally—the first 50% was driven by massive Central Bank stimulus even as the virus battered the real economy. The second 50%, beginning in November, was driven by continuing massive Central Bank stimulus and prospects for a “re-opening boom.”
The first leg ran for seven months; the second leg is now in its sixth month.
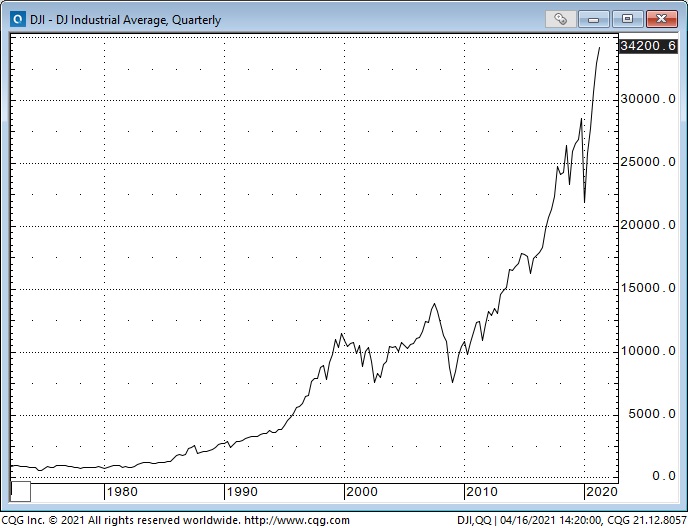
I think bullish enthusiasm has driven financial assets too high, too fast; this longer-term chart of the DJIA will give you a perspective on the HUGE rally from the 2009 lows.
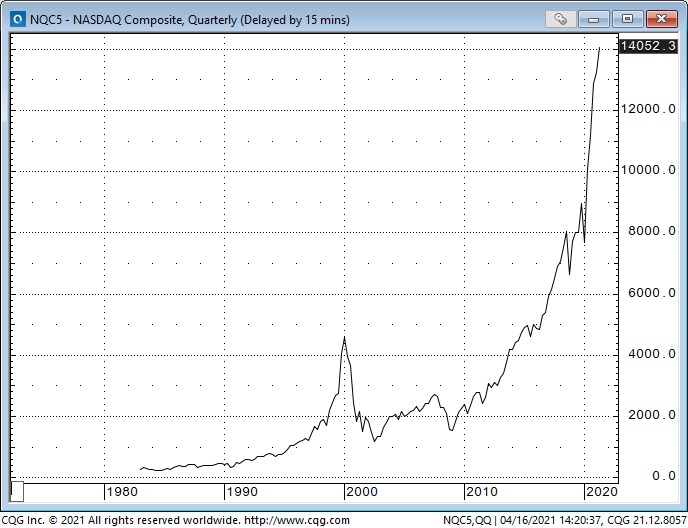
The DJIA is dull compared to the NASDAQ–which is up ~10X from the 2009 lows.
Do you remember the fantastic “Dot-Com” bubble of the late 1990s? It looks rather “small potatoes” on this chart. The NASDAQ tumbled 75% in just over 2 years from the 2000 highs.
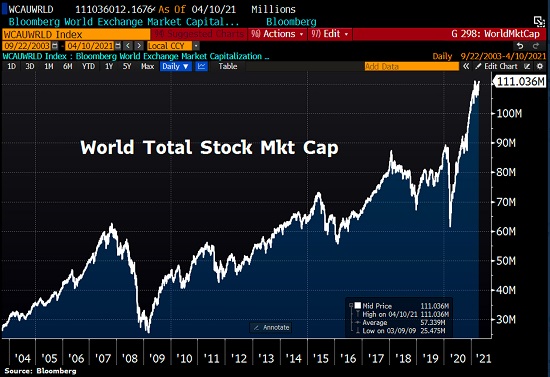
I understand that pervasive bullish enthusiasm could drive the stock market sharply higher from here—I get it. My point is that the market is “priced for perfection,” which leaves it vulnerable to a nasty correction should any “bad news” come along.
I’ve been short Russell Futures for 2 weeks (the Russell 2000 small-cap index has been the weakest of the major indices lately,) and I bought 3800-strike S&P puts on Friday’s close last week. Both positions were modestly against me at the end of last week.
Bonds: dead cat bounce?
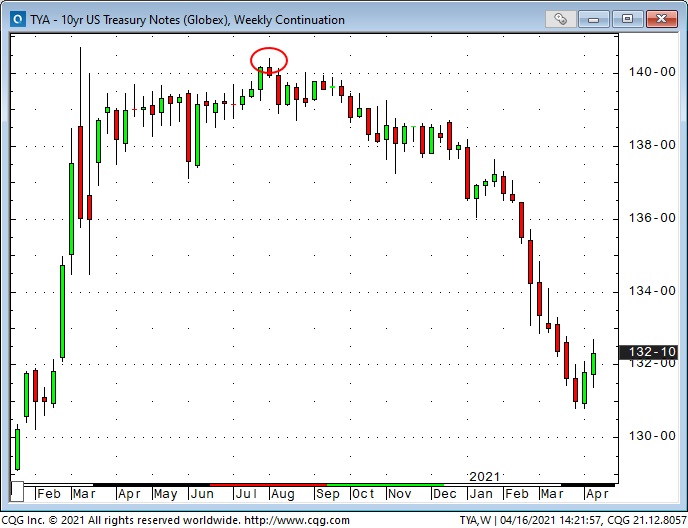
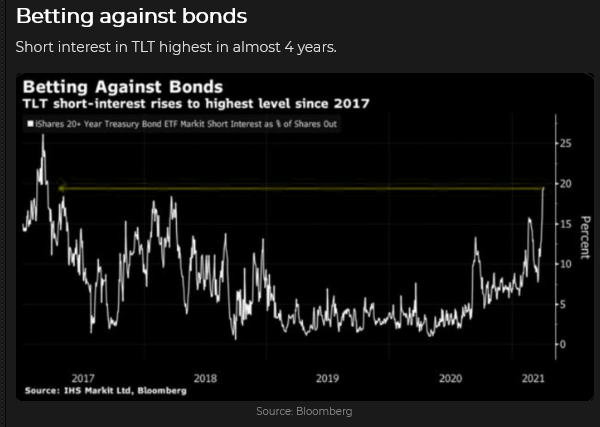
The 10-year Treasury bounced a bit the past couple of weeks after the relentless decline from last August when yields were at All-Time lows. Short-covering may have contributed to the bounce.
US dollar: nearly 50% correction of Jan—March rally
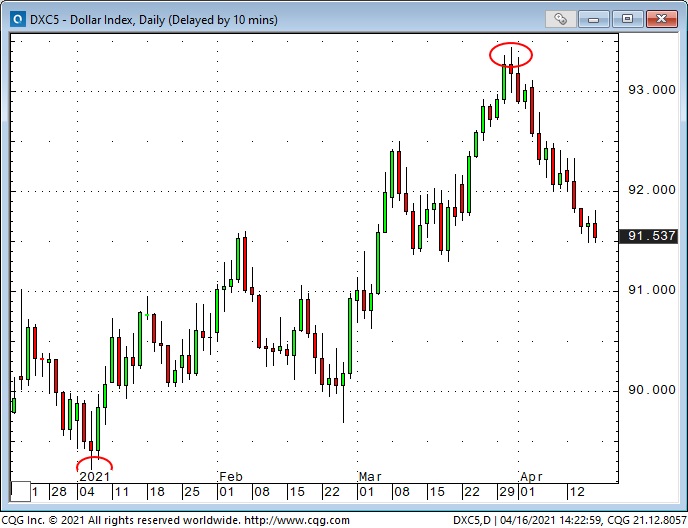
The US Dollar Index (USDX) rallied nearly 5% from the 33-month lows it made in January. Most of those gains were against the yen and the euro. Since the end of March, the USDX has given up half of its Jan to March gains. Nearly all currencies have rallied to some degree against the USD the past three weeks; but trade has been dull.
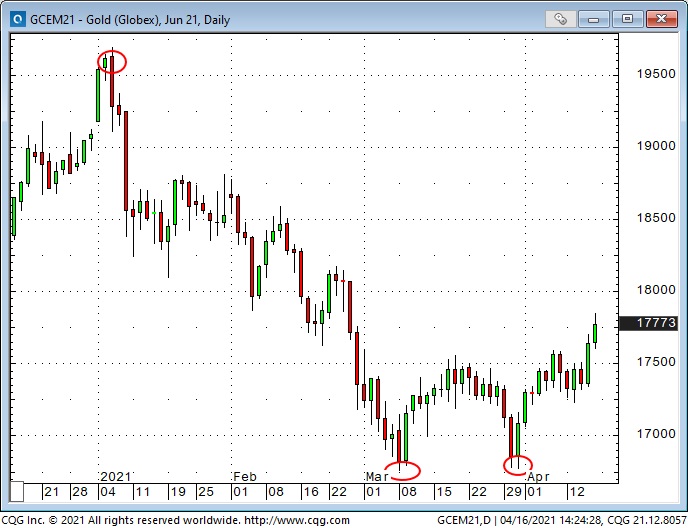
Gold: best close in 7 weeks
Gold made a classic double-bottom at 9-month lows in March and has bounced ~$100 as the USD has weakened the past 3 weeks. (In last week’s Notes, I wrote that gold had been the “flip-side” of the USD this year. Gold made its 2021 high on the same day (Jan. 6) that the USDX made it’s low. Gold turned higher on the same day (Mar. 31) that the USDX made its high YTD.
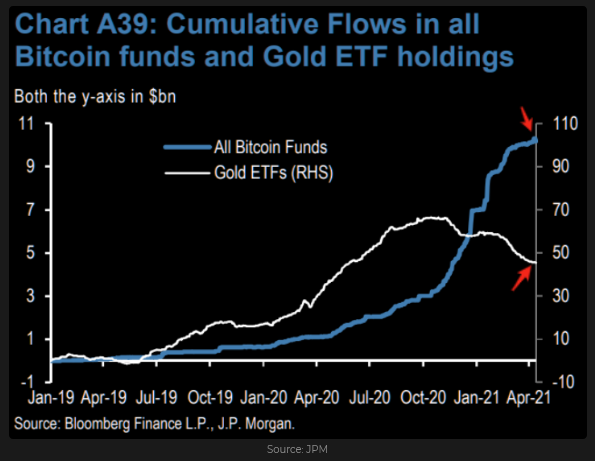
Bitcoin has “stolen” some market share from gold
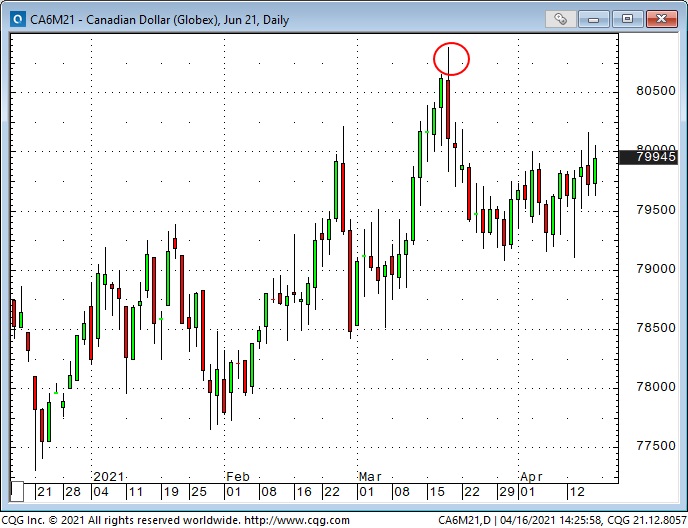
The Canadian dollar: dull in a narrow range
The CAD hit a 3-year high against the USD in March and has been the strongest of all major currencies in 2021. The CAD rallied the past 12 months as stocks and commodities rose, and the USD fell.
I bought 79-strike CAD puts two weeks ago when the CAD was around 7950, looking for it to drop below 79 cents. So far, I’ve lost ~50% of the option premium as the clock ticks against me, and the CAD drifts sideways.
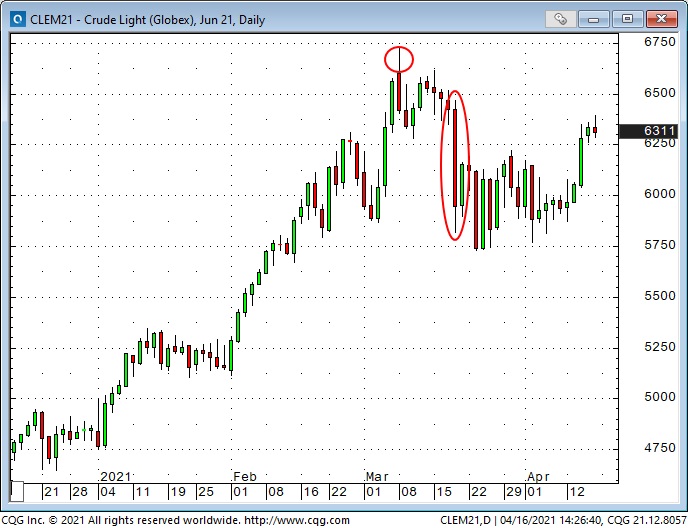
WTI crude oil: correction after 30-month high in March
WTI prices doubled from November to March ($34 to $68) as the “Energy Space” morphed from being the Dog of 2020 to the Darling of 2021 on the “re-opening story.” Prices steadied after a $7 one-day tumble in Mid-March and rallied ~$5 last week on up-grades to global demand estimates for the rest of 2021.
In keeping with my “too high, too fast” views, I’m looking for WTI to roll over and take out the March lows. I initiated bearish put spreads on WTI the previous week.
My short term trading
The previous week I wrote:
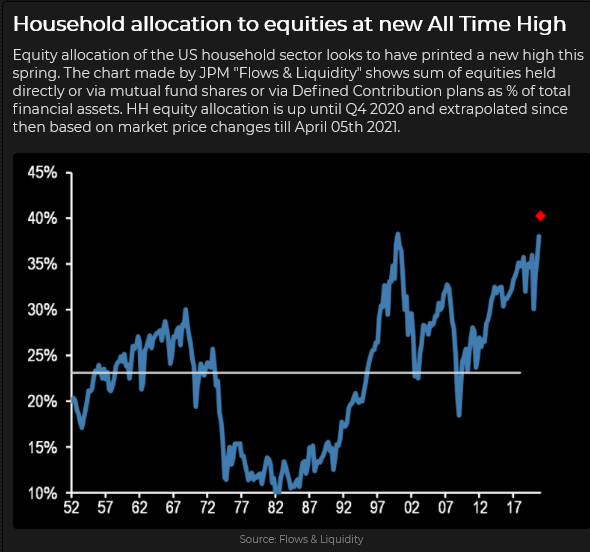
My Primary assessment of current market psychology is that a “virtuous circle” of aggressive pro-risk buying has driven asset prices higher, which in turn has encouraged more pro-risk buying. The market is “priced for perfection” and vulnerable to a sharp correction.
My Alternative assessment is that bullish market psychology may continue to drive risk asset prices higher.
In-line with my Primary Assessment, I ended the previous week with bearish positions in equities, the Canadian Dollar and WTI. (Detailed in the short-term trading section of last week’s notes.) Out of respect for my Alternative Assessment, I kept my position size small and mostly used limited risk options strategies. I maintained all of those positions last week.
There were two main reasons for keeping my position size small and using limited risk options strategies:
- I was “top-picking” market psychology, and
- I wanted to establish positions that I could hold for a longer period of time without being “stopped out” by short-term choppy price action.
If all of my current positions go “totally” against me, I will lose just over 1% of my trading capital. If the positions I currently have on go in my favor, I could reasonably expect a 3% or more gain.
On my radar
If the market moves in my favor, I will try to add to my existing positions.
