Massive stimulus from governments and Central Banks created a powerful “risk on” market psychology that drove equities and commodities higher and the USD lower over the past few months. We think this “risk on” market psychology is in the process of reversing and we’ve been trading accordingly.
Mega cap tech had a spectacular run in this “risk on” environment...supercharged by the virus “disruption” effect and the unprecedented levels of public speculation in option “lottery tickets” with the “cherry on top” provided by aggressive buying in front of Apple (NASDAQ:AAPL) and Tesla (NASDAQ:TSLA) stock splits. (It’s no surprise that NASDAQ reversed course within 2 days of the split shares beginning to trade.)
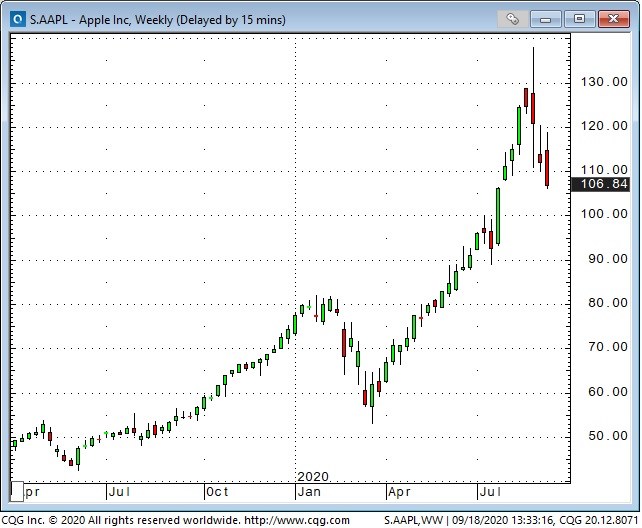
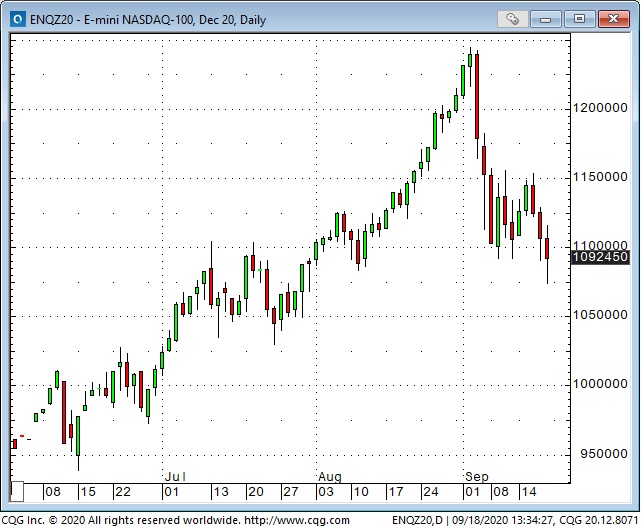
We thought that the “process of reversing” would not be a “V” shaped top...we expected BTD buying to give the market a significant boost after the first leg down...but so far the “bounce” has been modest and Friday’s break below the August lows may temper the apparently widely held belief that, “Stocks only go up.”
The Fed met the “Go Big Or Go Home” challenge in March through June but has gone relatively “quiet” since then...it seems the Fed is looking to the government to provide additional stimulus...but the government has been MIA in terms of political compromise so far...although historical precedence would lead us to believe that “political calculus” will produce another round of stimulus before the first Presidential debate on September 29.
We understand that we will see record GDP growth from the “hole” that the economy fell into...but the virus and lockdown “disruptions” have left millions of people unemployed and we wonder what happens when the various “forbearance” programs come to an end and the banks and landlords start pressing for payment. Or what happens if we get a serious 2nd wave of the virus?
We’ve previously written about the “All One Market” idea where recently “risk on” market psychology meant stocks and commodities up and the USD down. Our trading experience tells us that once you identify an intermarket relationship it often stops working.
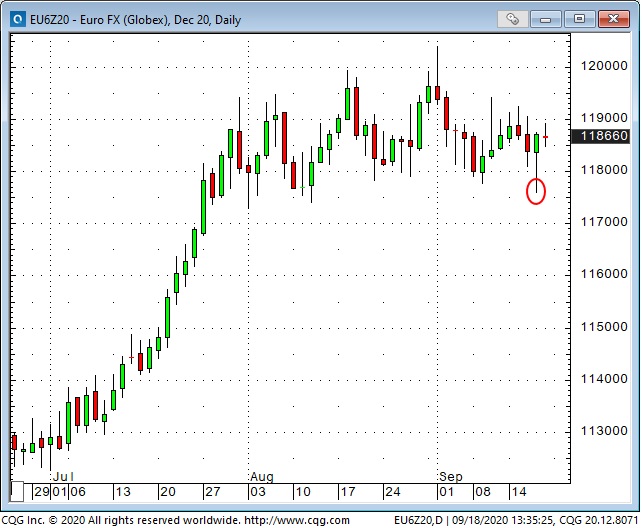
Our focus here is on the US Dollar Index which has fallen ~10% from its March highs...when capital flooded into the USD for safety. We’ve thought that if the equity market started to trend lower that the US Dollar would start to rally. We still hold that thesis but our conviction level wavered on Thursday when the EUR/USD traded to a one month low...BUT...then reversed to close higher on the day...and then traded higher again Friday even as the major American equity indices were under heavy selling pressure.
The EUR/USD had a great opportunity to break down...but didn’t...and that may be an important “tell”...or it may be that the market just reverted to the sideways trend it’s been in for 6 weeks.
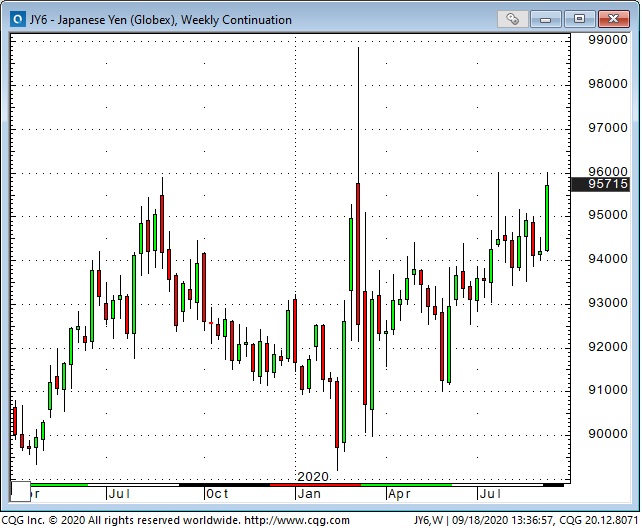
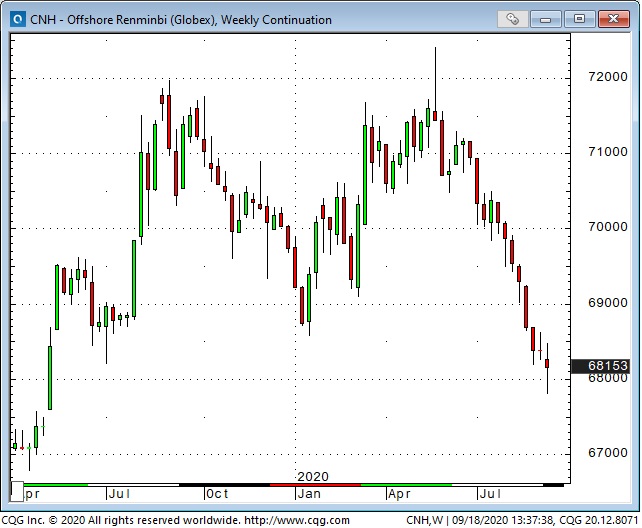
The yen and the Renminbi have also been strengthening against the USD the past couple of months. (The CNH chart falling means it takes fewer Renminbi to buy one USD.)
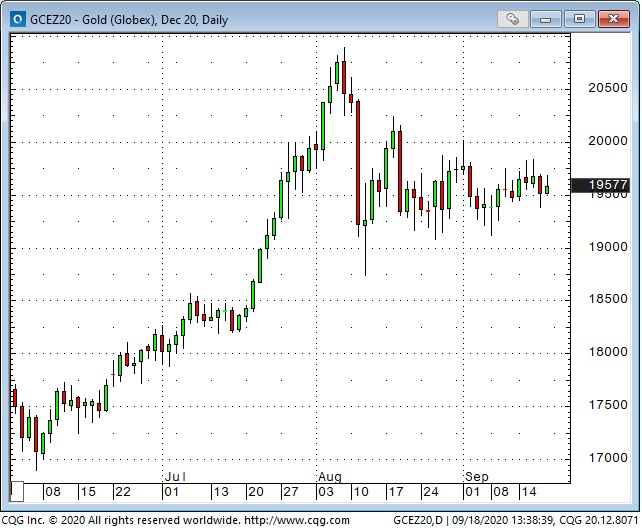
The gold market has benefited from ~$100 billion flowing into global Gold ETFs this year...the total global gold ETF market is ~$240 billion so that $100B is significant. We’ve thought that gold was at risk of correcting lower if stocks fell and the USD rallied. We still think that’s a significant risk but if the USD weakens gold will likely rally.
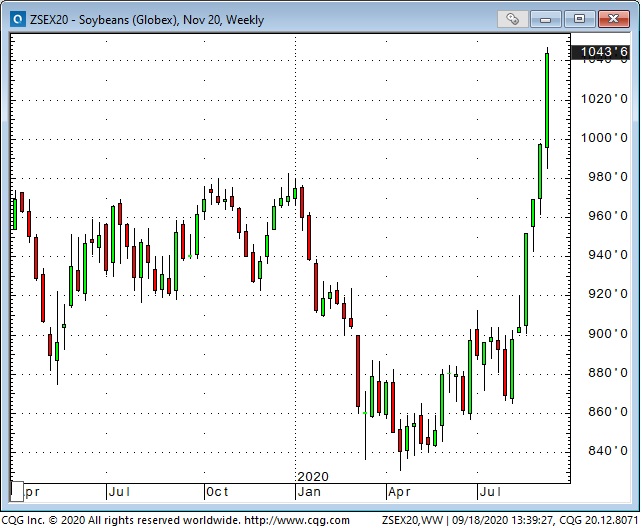
Soybeans have rallied to a 2 year high...apparently, Chinese buying (in line with the trade agreement) is making the difference.
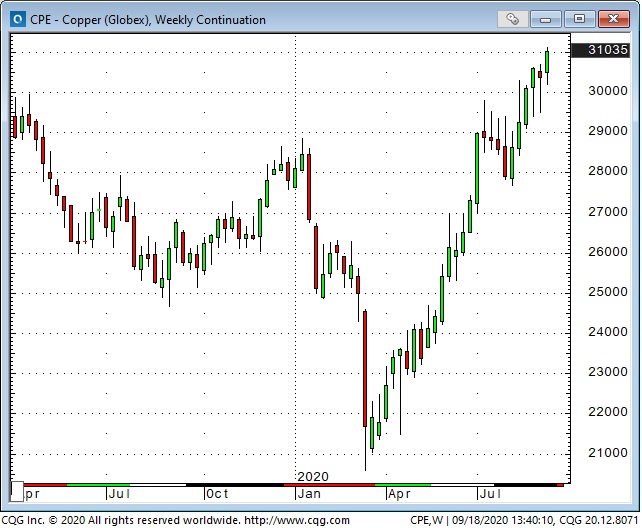
Copper has also rallied to a 2 year high...again Chinese buying is credited...although you get the idea that the prospect of millions of new electric cars may be inspiring some speculative buying!
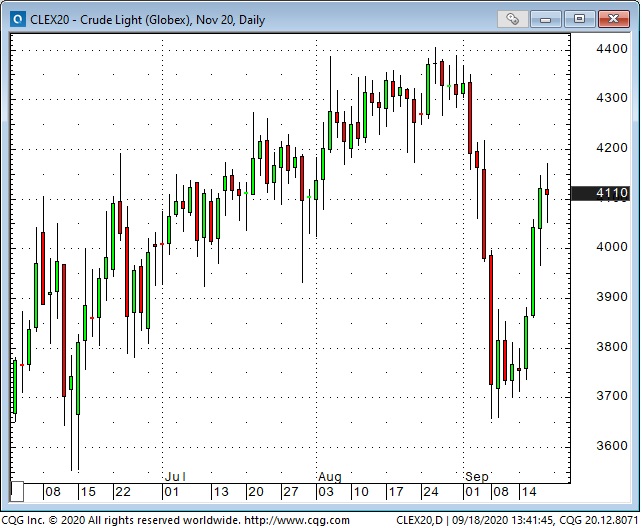
Crude oil fell ~$7BBL the past two weeks and rallied back ~$4 this week with a little help from OPEC and hurricane worries. We’ve viewed crude as a lack-of-demand story the past couple of months and we positioned for contango spreads to steepen. They did and we closed those positions this week for a decent profit. We started to reposition short WTI Friday.
