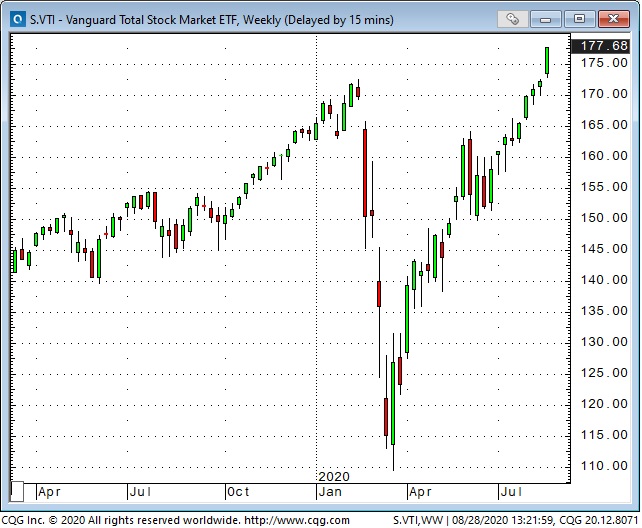
Since the February All-Time Highs we’ve had the shortest bear market ever...followed by the fastest recovery to a new record high in over 80 years. We’re very lightly positioned at the end of the week...thinking that September may bring some serious reversals across markets. Don’t be short volatility!
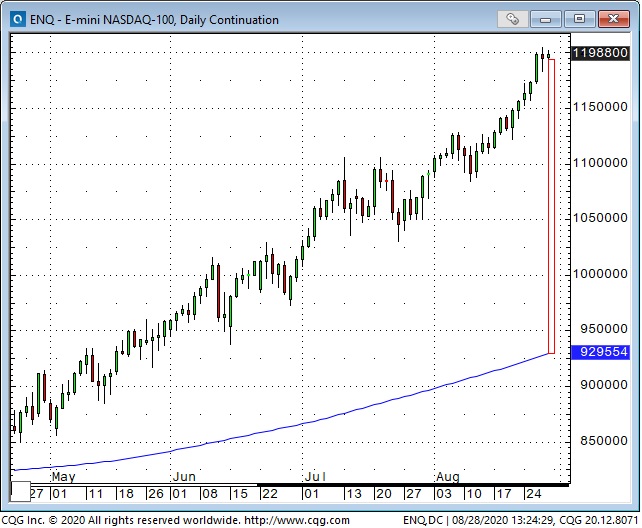
The Nasdaq 100 has rallied ~70% from the March lows and is currently at a record widespread over its 200 day moving average. The CNN Fear and Greed index is ~80%...it’s highest reading since February.
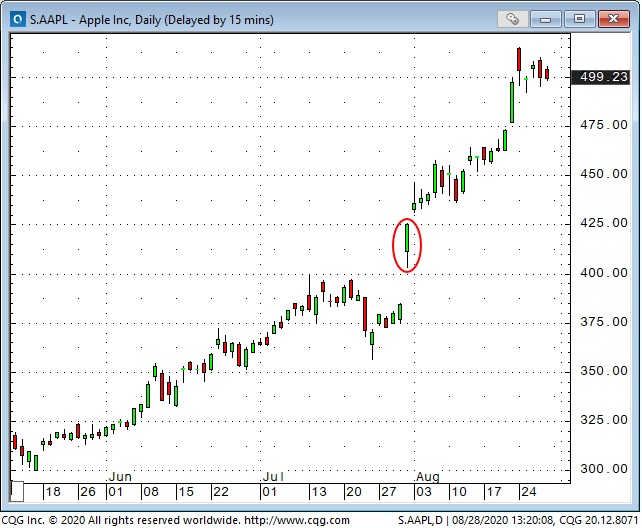
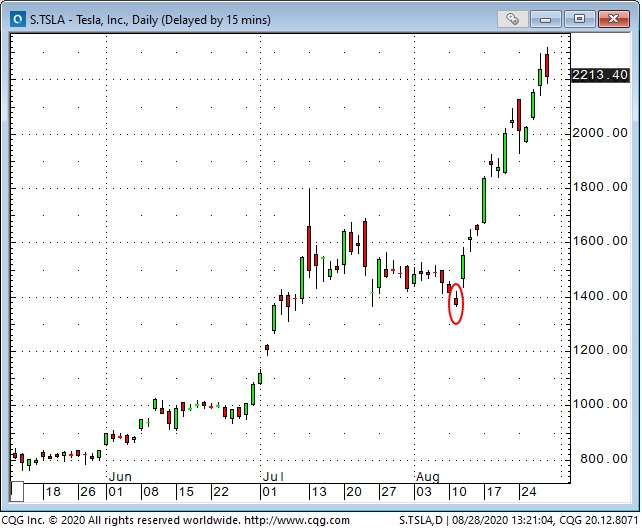
Apple (NASDAQ:AAPL) and Tesla (NASDAQ:TSLA) split shares begin trading Aug 31. Perhaps the multi-billion dollar ramp in their shares since they announced the splits (circled dates in the charts) will qualify as the “silly summer trade” we wondered about in our Aug 15 notes.
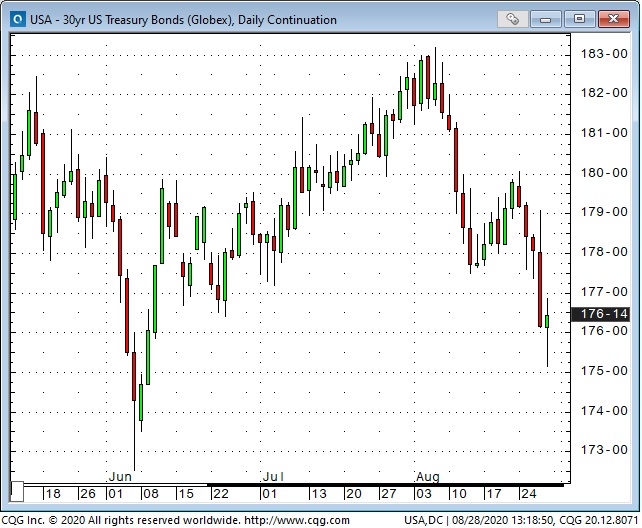
Fed Chairman Powell formally introduced Average Inflation Targeting (AIT) on Thursday...in essence saying that the Fed will tolerate higher inflation for longer before restraining it by raising rates. Long bond prices tumbled on the announcement while the short end was flat...the yield curve steepened. On Aug 15 we wondered, “If the bond market isn’t starting to choke on the massive Treasury (and corporate) issuance...and from a different angle, if the Fed really wants to see inflation north of 2% maybe they’d be ok with a steeper curve and 2%+ yield on the long bond.”
We’ve wanted to short bonds but were worried they would be aggressively bid if the stock market tumbled. So far we’re wrong on both counts.
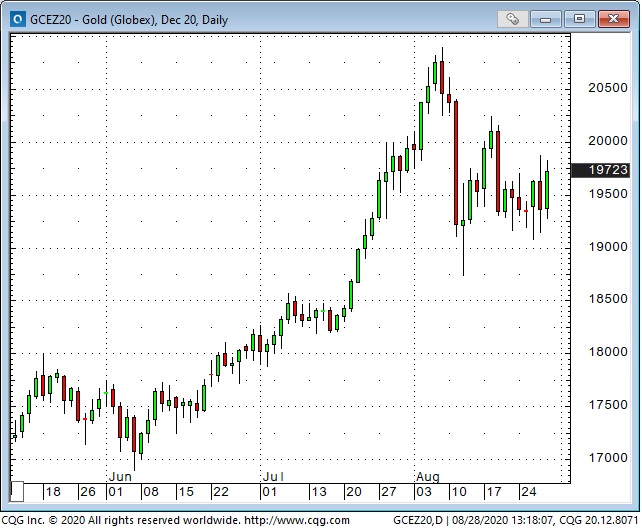
Gold price action has been very choppy in August with 10 of the last 20 trading days seeing at least a $50 high/low range. We caught a $100 tumble from the August highs and another $50 break following the Buffet/Barrick bounce and still hold the bearish put spread we established near the end of July.
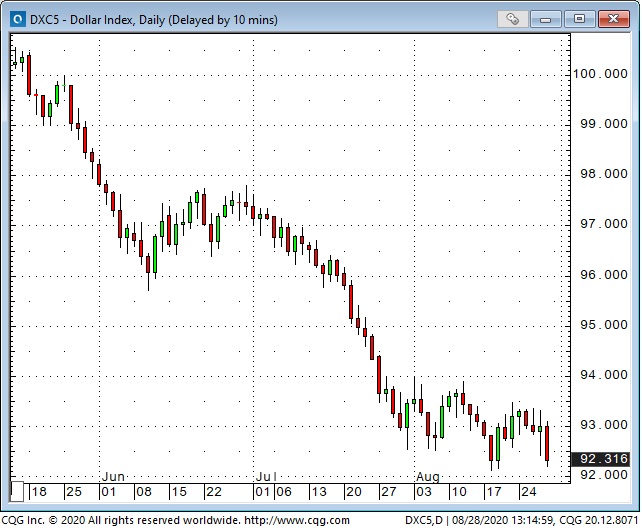
The US Dollar index is at a 27-month low...weak across the board with virtually all currencies (developed and emerging markets) rising against the USD. The bearishness on the USD is nearly as pervasive and extreme as the bullishness on stocks. Somehow it feels as though they are two sides of the same coin.
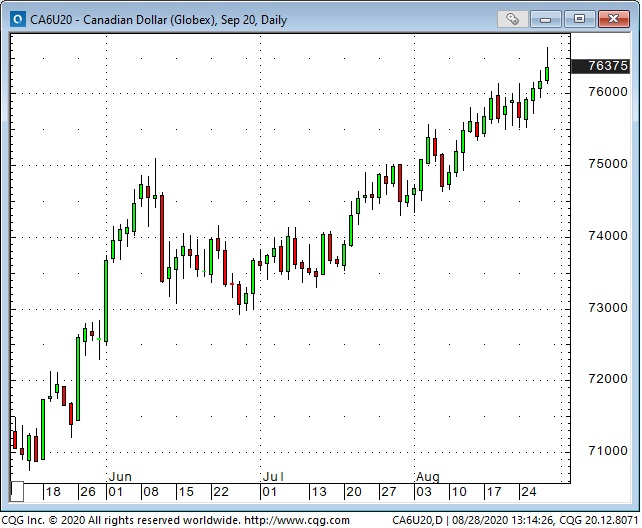
The Canadian Dollar has surprised us with its continuing strength...tied to USD weakness, rising commodity indices and the general “risk-on” market psychology. CAD has been highly correlated to the S+P 500 index since February.
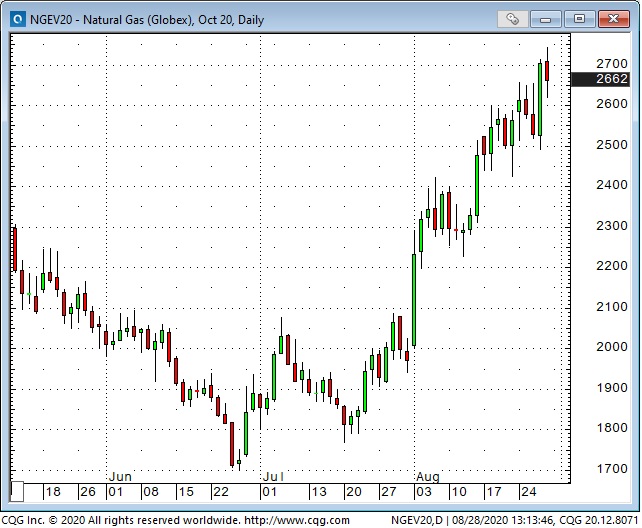
The crude oil market remains a lack-of-demand story. There was virtually no lift in WTI prices ahead of hurricane Laura when nearly all of the gulf coast production and refining was closed. We remain bear spread the WTI contango: short Dec / long March. Nat Gas has been a different story with front month October up more than 50% from the June lows.
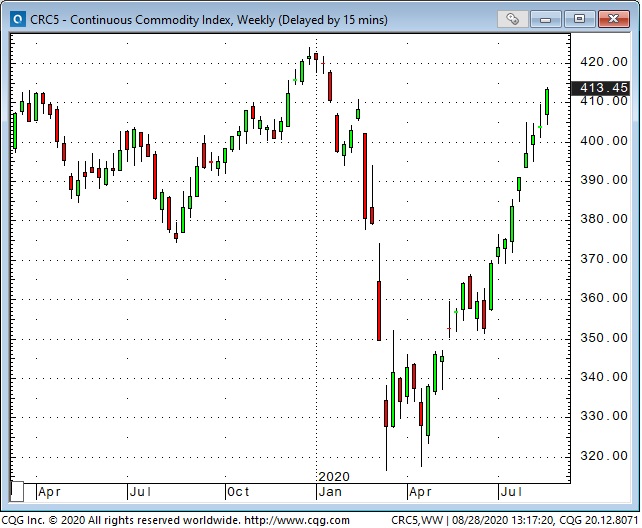
The benchmark CRB commodity index has been in a bear trend since 2011 but has had a sharp rally since the March/April lows.
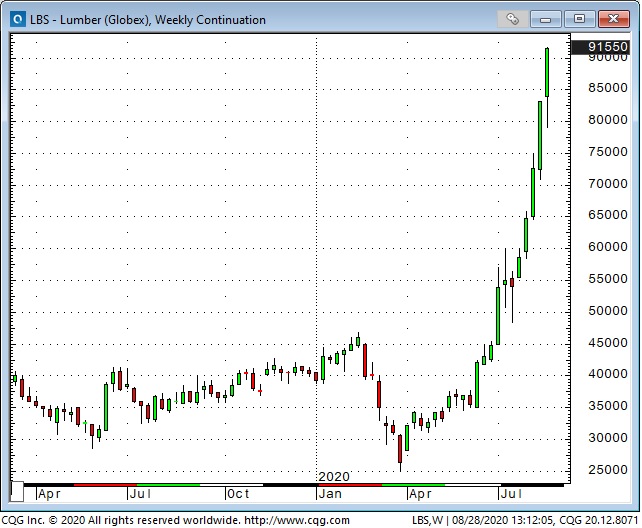
Lumber has been spectacular...lumber spreads, even more, so...with the front-month limit bid Friday while deferred months were limit offered.
