Last week we came to the end of the first quarter of the year. This first quarter we saw some strong movements followed by some sideways price action. After the strong bearish move, we saw at the end of last year, the first quarter of this year was able to make back all the down move plus some more. We will see if the market will be able to find a new direction for the second quarter of the year or if we continue this sideways movement.
Currently, we are seeing a lot of concern over the global economic conditions and prices seem to move quickly as new information comes out. One of the biggest topics right now is whether a trade agreement with China will be made. If this happens, we should see the market respond positively. This week we are going to see how the employment situation is going as the nonfarm employment numbers are released on Friday.
The chart below shows an example of how important it is to find and trade in the direction of the trend. As we look to take trades, make sure you can have a certain level of confidence that the trades you are taking are supported by the overall trend. While there are opportunities to trade counter to the trend, the probabilities are that price will continue to in the trend direction.
Let’s look at how the markets performed this last week.
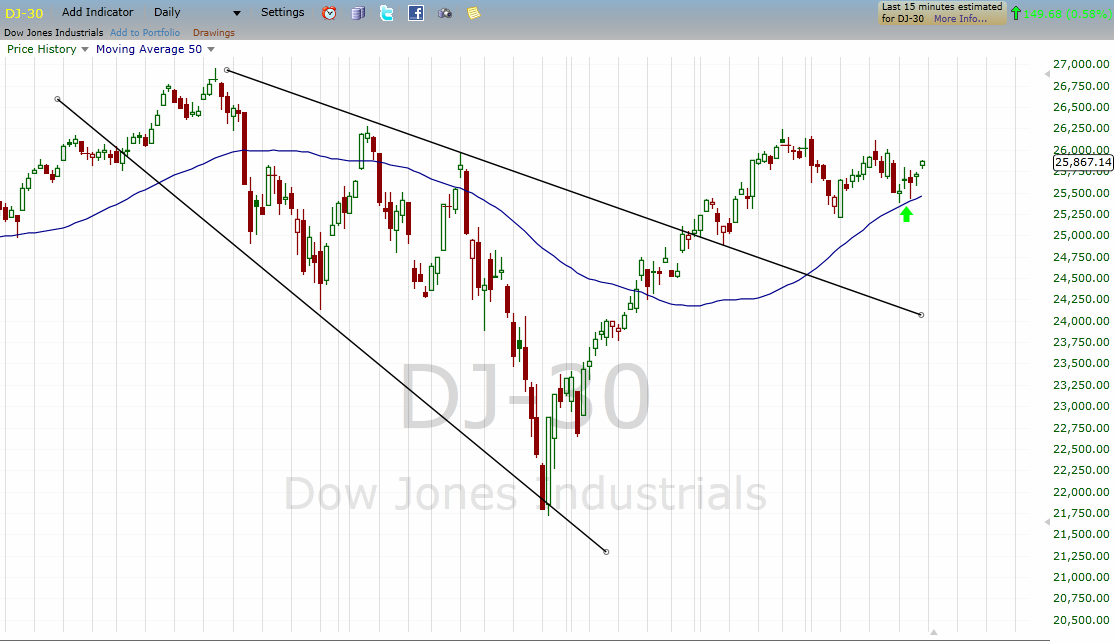
DJ-30

This past week we saw the market move higher as it was able to catch a bounce off the area of resistance. The 50-period simple moving average is continuing to move higher and it looks like the prices might want to continue the move up. The next level of potential resistance is going to happen at the prior swing high. If price can move above it, we may see prices move into new highs for the year. The news may impact this so we will see what happens.
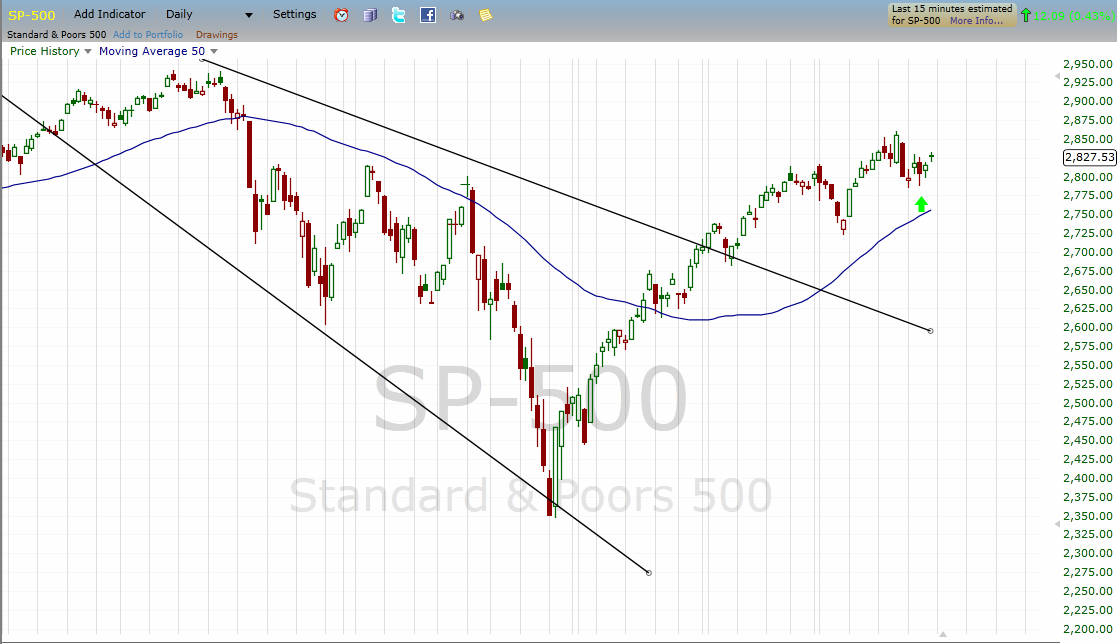
SP-500

The SP-500 also saw a bounce up this past week. The 50-period simple moving average continues to support a bullish direction. A push above the prior swing high will lead to more bullish movements in the SP-500. While we are continuing to see the strong bullish moves, we need to recognize that a retracement is going to happen. When and where it happens is the question, we don’t know the answer to, so we need to make sure we are watching for the signs that show us the down move is beginning to happen.
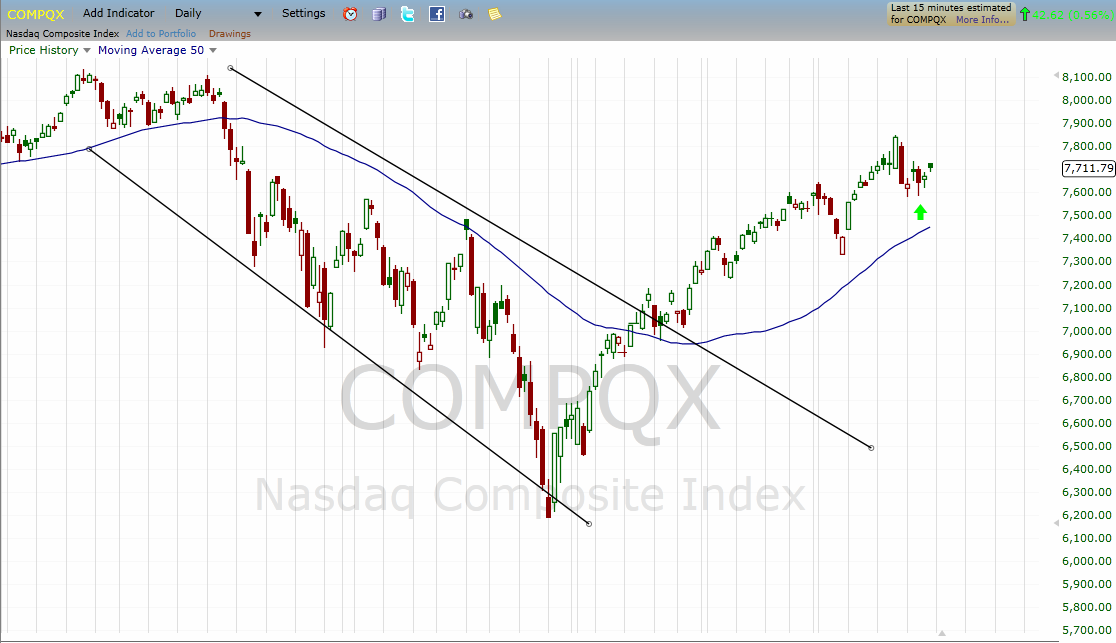
NASDAQ

The daily candles on the NASDAQ show what looks to be the strongest movements of the three charts we are looking for. It is likely that we will see price try to take out the prior highs as it continues to move up. Looking for a change in the highs and lows will help us identify the time where price will become more bearish. Until that happens, we will continue to look for bullish trading opportunities.
While we don’t know when the markets will change, we do have the tools to be able to identify the trend change. What we don’t want to do is assume that prices won’t move any higher. This is a dangerous way to look at the markets. We trade what we see happening, not what we think is happening. Make sure you are continuing to use stop losses and good risk management in all your trades.
