Topping Pattern Lessons From Today's Hottest Sector, Global Index

Published 03/26/2015, 08:21 AM
Updated 07/09/2023, 06:31 AM
US500
-
DE40
-
XBI
-

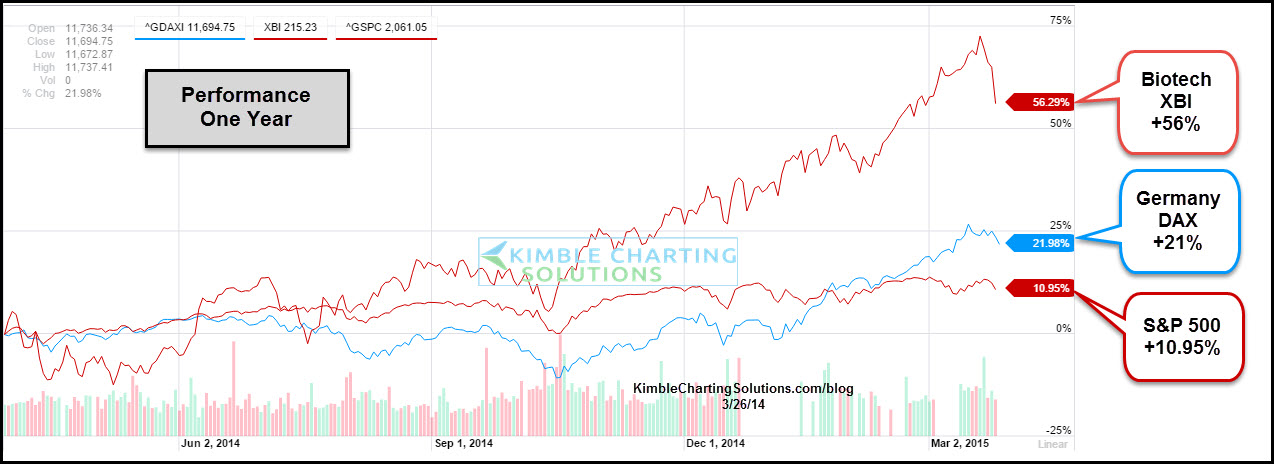
One Year Performance: XBI, DAX, S&P 500

I am a fan of watching leadership. When leaders get into trouble, they can have a huge influence over the broader markets. The above chart looks at the S&P 500 and the hottest sector and hottest key global stock index of late. Over the past year the SPDR S&P Biotech ETF (NYSE:XBI) is up almost 5 fold more than the S&P 500. The DAX, the German equities index, is up twice as much.

So how are the hottest of the hot doing?

The 2-pack below looks at the patterns in the DAX XBI
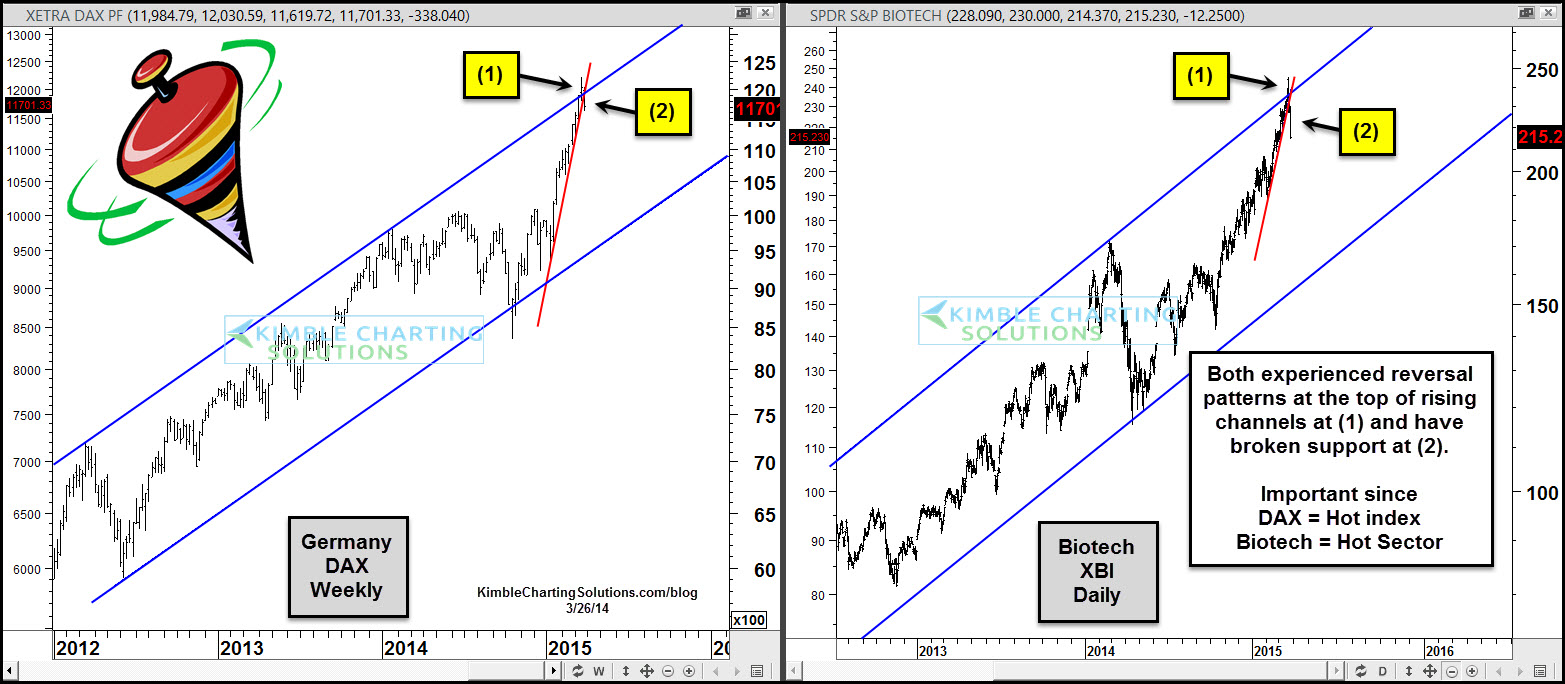
DAX Weekly, XBI Daily

What do the hottest of the hot have in common? Strong rallies over the past year that took them to the top of rising channels. Both look to have created reversal patterns (bearish wicks) at (1). Both are attempting to break rising support at (2).

As I shared at the start of this post, I humbly feel that keeping a close eye on leadership is very important. Investors might benefit from keeping a close eye on these two in case further weakness takes place, because selling pressure in leadership assets can spill over into lagging areas!

Latest comments

Loading next article…
Risk Disclosure: Trading in financial instruments and/or cryptocurrencies involves high risks including the risk of losing some, or all, of your investment amount, and may not be suitable for all investors. Prices of cryptocurrencies are extremely volatile and may be affected by external factors such as financial, regulatory or political events. Trading on margin increases the financial risks.
Before deciding to trade in financial instrument or cryptocurrencies you should be fully informed of the risks and costs associated with trading the financial markets, carefully consider your investment objectives, level of experience, and risk appetite, and seek professional advice where needed.
Fusion Media would like to remind you that the data contained in this website is not necessarily real-time nor accurate. The data and prices on the website are not necessarily provided by any market or exchange, but may be provided by market makers, and so prices may not be accurate and may differ from the actual price at any given market, meaning prices are indicative and not appropriate for trading purposes. Fusion Media and any provider of the data contained in this website will not accept liability for any loss or damage as a result of your trading, or your reliance on the information contained within this website.
It is prohibited to use, store, reproduce, display, modify, transmit or distribute the data contained in this website without the explicit prior written permission of Fusion Media and/or the data provider. All intellectual property rights are reserved by the providers and/or the exchange providing the data contained in this website.
Fusion Media may be compensated by the advertisers that appear on the website, based on your interaction with the advertisements or advertisers.
© 2007-2025 - Fusion Media Limited. All Rights Reserved.