After reviewing over 1,000 charts, I have found some good setups for the week. This week’s list contains the first five below to get you started early. These were selected and should be viewed in the context of the broad Market Macro picture reviewed Friday which as we head into the new week sees the equity markets continuing to hold onto long term uptrends, consolidating in broader ranges. They also printed nearly identical weeks, ending lower.
Elsewhere look for Gold to continue to consolidate in a broad range while Crude Oil consolidates with a bias lower. The US Dollar Index looks to mark time sideways while US Treasuries consolidate with a bias higher. The Shanghai Composite returns after a short week stuck in a range at the February lows while Emerging Markets continue to build a bull flag at the highs. Volatility looks to remain elevated creating a headwind for the equity index ETF’s SPDR S&P 500 (NYSE:SPY), iShares Russell 2000 (NYSE:IWM) and PowerShares QQQ Trust Series 1 (NASDAQ:QQQ). Their charts show broad consolidation after the recent pullback with the QQQ at greatest risk of a move lower. Use this information as you prepare for the coming week and trad’em well.
Diamond Offshore Drilling Inc (NYSE:DO)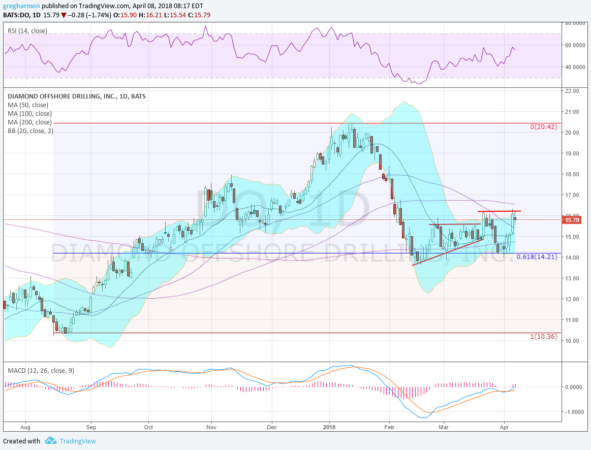
Diamond Offshore, $DO, attempted to breakout higher two weeks ago, but the move petered out. It pulled back to retest the 61.8% retracement if the move to the January high, holding at a higher low. The reversal now sees it at the prior top. The RSI is pushing on the bullish zone with the MACD about to go positive. There is resistance at 16.25 and 17.55 then 19.10 and 20.40. Support lower comes at 15.60 and 14.75 then 14.25. Short interest is high at 19.8%. Enter long on a move over 16.25 with a stop at 15.60. As it moves over 16.65 move the stop to break even and then to a 65 cent trailing stop over 16.90. Let the stop take you out of the trade. As an options trade consider the April 15 Calls (offered at $1.15 late Friday) and trade them like the stock trade (using the stock price as a trigger, stop and target).
Honeywell International Inc (NYSE:HON)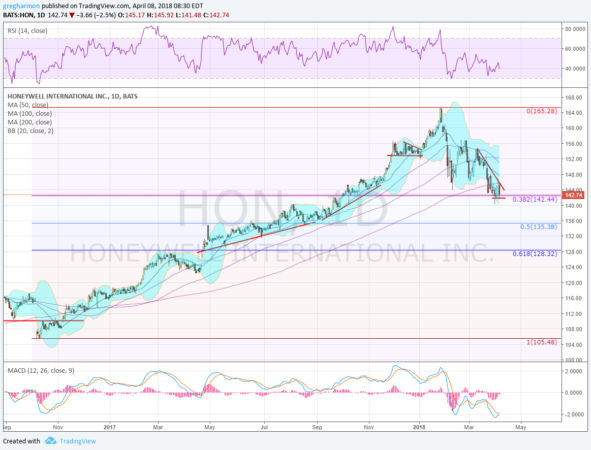
Honeywell, $HON, started lower from a top in January. Last week it made a lower low, breaking below its 200 day SMA and retracing 38.2% of the move higher from October 2016. The RSI is in the bearish zone and turning back lower as the MACD looks to be avoiding a cross up. There is support lower at 141.75 and 140 followed by 135.50 and 132 before 128.30. Resistance comes at 145.70 and 147.50. Short interest is low at 1.1%. Enter short on a move under 141 with a stop at 144. As it moves under 139 move the stop to a $3 trailing stop and let the stop take you out of the trade. As an options trade consider the April 141 Puts ($2.40) and trade them like the stock trade. Sell the April 135 Puts (82 cents) to lower the cost. The company is expected to report earnings next on April 20th.
Shake Shack (NYSE:SHAK)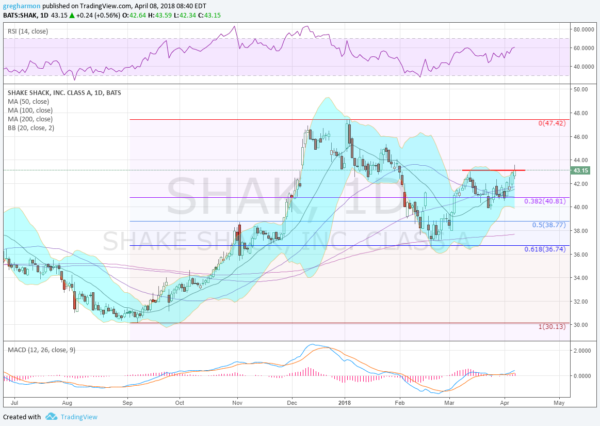
Shake Shack, $SHAK, made its top at the beginning of January. Since then it retraced 61.8% of the move higher and found support at the 200 day SMA in the middle of February. It rebounded and met resistance in March and pulled back to a higher low. Now it is back testing that March high with a RSI that is rising into the bullish zone and a MACD crossed up, rising and positive. There is resistance at 43.25 and 45 then 47.40. Above that you need to go back to 2015 to find it at 53 and 56 then 60. Support lower comes at 41.80 and 40.80 before 40. Short interest is high over 35%. Enter long on a move over 43.60 with a stop at 41.50. As it moves over 44.50 move he stop to break even and then to a $2 trailing stop over 45.60. Let the stop take you out of the trade. As an options trade consider the April 43.50 Calls ($1.10) and trade them like the stock trade.
Visa Inc (NYSE:V)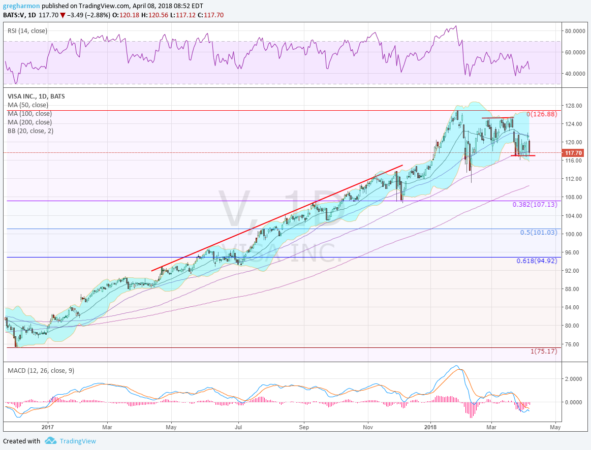
Visa, $V, ran from a low in November 2016 to a top in January. It pulled back to its 100 day SMA in February and bounced, but to a lower high. The reversal from there has found support at the 100 day SMA over the past 2 weeks. The RSI also found support but is struggling to move higher as the MACD avoids a cross up and turns lower. There is support at 116.75 and 113.65 then 112.25 and 107, a 38.2% retracement of the move higher. Resistance above sits at 120.40 and 122.50 then 125.20 and 126.90. Short interest is moderate at 6.4%. Enter short on a move under 116.00 with a stop at 118.50. As it moves under 114.50 move the stop to break even and then to a $3 trailing stop under 113. Take off 1/3 on a stall at 107 or lower. As an options trade consider the April 116 Puts ($1.73) and trade them like the stock trade. Sell the April 111 Puts (59 cents) to lower the cost.
Vodafone (LON:VOD)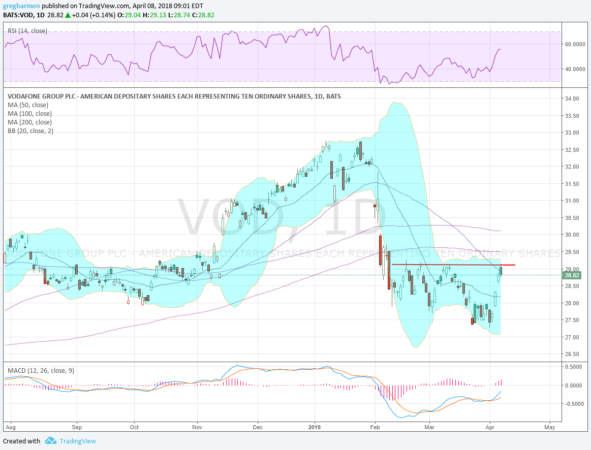
Vodafone, $VOD, pulled back from a high in January, stalling in early February. It drifted lower then, finding a bottom in March, all while momentum was diverging higher. It is back at the top of the consolidation bounce now with the RSI rising toward the bullish zone and the MACD moving higher toward zero. There is resistance at 29.20 and 30 with gaps to fill at 30.32 and 32.02 above then 32.75. Support lower comes at 28.60 and 27.90 then 27.30. Short interest is low under 1%. Enter long on a move over 29.25 with a stop at 28.50. As it moves over 29.60 move the stop to break even and then to a 70 cent trailing stop over 29.95. As an options trade consider the April 29 Calls (42 cents) and trade them like the stock trade.
DISCLAIMER: The information in this blog post represents my own opinions and does not contain a recommendation for any particular security or investment. I or my affiliates may hold positions or other interests in securities mentioned in the Blog, please see my Disclaimer page for my full disclaimer.
