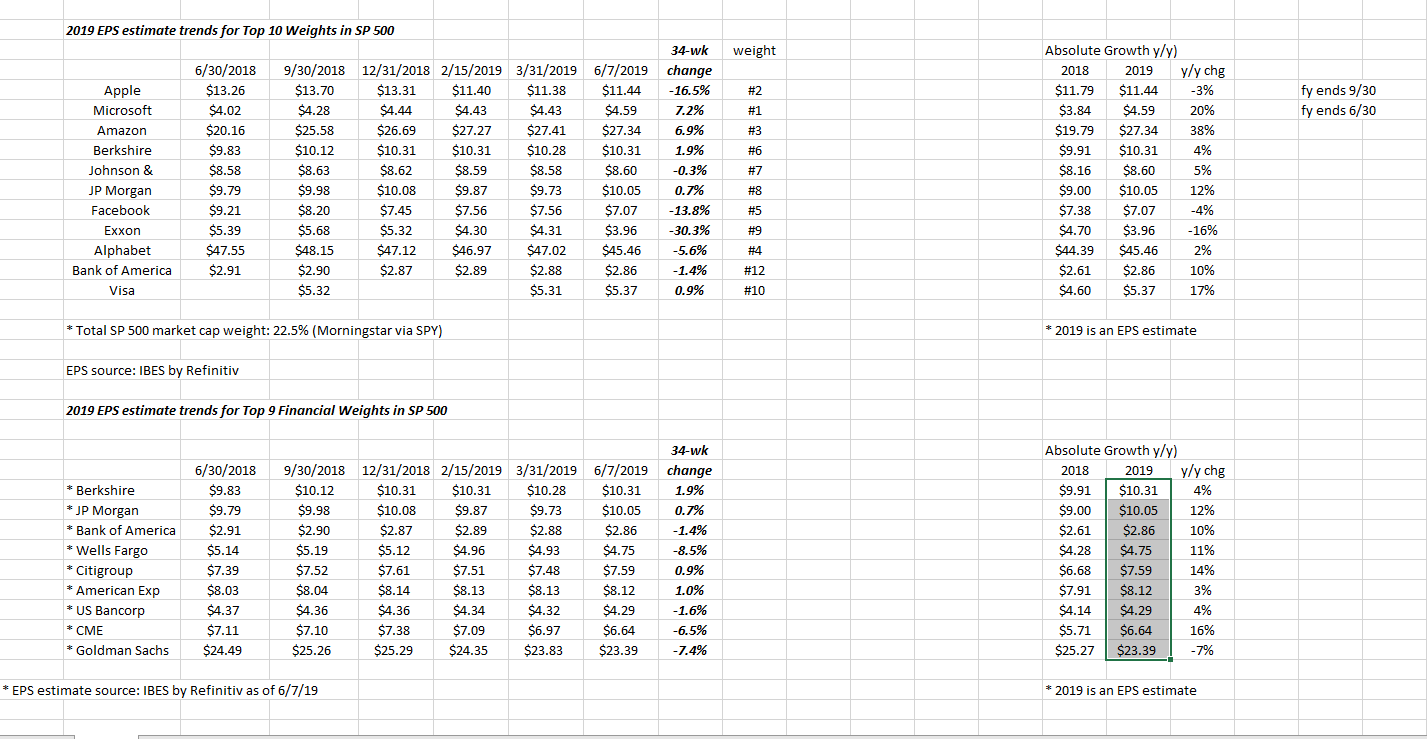
Since the S&P 500 peaked in late September ’18, the goal of the attached spreadsheet was to give readers a feel for the change in the EPS estimates for 2019, relative to the market action and change in the S&P 500’s return.
The fascinating metric for me is that the Top 10 S&P 500 market cap weights represent 22% of the benchmark by market value, and that’s been consistent since this blog has been tracking the Morningstar data.
Since Jan ’18, the S&P 500 is flat (the S&P 500 peaked in Jan ’18 around 2,872, and closed at 2,875 this Friday, June 7th), and since Sept. ’18, the S&P 500 is down a smidge from a capital gain perspective, but the 2019 EPS estimates for the Top 10 weights are looking for an arithmetic average of 8% growth this year, versus an expected growth rate of 3% for the benchmark itself.
Microsoft (NASDAQ:MSFT) still looks the best in terms of EPS and revenue revisions, with their fiscal year ending 6/19.
Facebook (NASDAQ:FB) and Exxon (NYSE:XOM) have had the sharpest negative revisions since 9/30/18, and also are 2 of the 3 stocks that are looking for negative y/y EPS growth for calendar 2019, the other being Apple (NASDAQ:AAPL).
Since Financials are a client overweight given their dividends and valuation, the top 9 Financial weights in the S&P 500 have been tracked as well, in terms of expected 2019 EPS growth. What’s interesting is that Goldman Sachs (NYSE:GS) is the only major Financial weight to show an expected decline in 2019 EPS growth and most Financials are expecting better-than-S&P 500 earnings for this calendar 2019.
The Financial sector is definitely experiencing “P.E compression” for the S&P 500 as a whole. As noted last week, Financial sector EPS growth has actually strengthened since April 1, and yet the sector continues to trade poorly.
The last update on the “Top 10 Weights” was 3/31/19, so this weekend’s update is a little later than usual.
Procter & Gamble (PG) has been working its way up the market cap ladder, with PG in the #11 spot and Bank of America (NYSE:BAC) falling to #12. Visa (NYSE:V) remains in the #10 spot.
IBES by Refinitiv did not publish a “This Week in Earnings” update this weekend. The staff – David Aurelio and Tajinder Dhillon – were out of the office this past week.
Summary/conclusion: Microsoft has returned to juggernaut status as it has regained the #1 market cap position in the S&P 500 after it spent 16 years trading below its January 2000 high of $53.81. Microsoft has been clients #1 position since 2013 – 2014 when Satya Nadella was named CEO and Microsoft started focusing on the Cloud, unfortunately, clients #2 weights have been Charles Schwab (NYSE:SCHW) and that position has been a drag on performance the last 18 months.
Here is the point for readers: the top 10 – 15 weights in the S&P 500 are the benchmark.
“Value” as an investment style had a good week this week: the SPYV (S&P 500 Value ETF) returned 4.95% vs the SPYG (S&P 500 Growth ETF) returned 4.04%.
Value has been out of favor for a while – in terms of relative performance, if “Value” starts to outperform, it might benefit Financials and if small and mid-cap start to outperform, the Top 10 of the S&P 500 may tread water.
