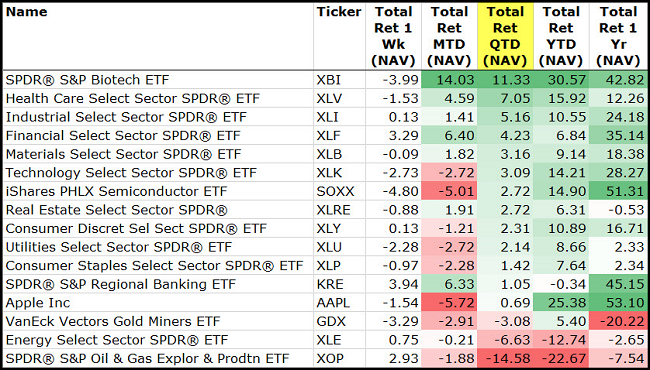
The recently-ended second quarter of 2017 needed a bit more sugar from technology-driven NASDAQ to make it perfect for investors. While it was a nearly solid quarter all around for equity and risk-seeking investors, the June pickup in Nasdaq volatility left some with a sour taste in their mouth. What was the catalyst for the tech pullback? Start with 30-50% price gains over the previous 12-months. Throw in some coordinated global central bank jawboning and three months of little-to-nothing from Washington D.C. and you could easily make the case for a market that needs to rest.
While a summer pullback, or small correction, would be healthy right now, it is difficult to see the reasons for a definitive peak in the market. The credit markets remain as solid as ever and access to capital is still incredibly easy. Earnings remain steady and we are two weeks away from, what should be, another good reporting season.
Global economies continue to rebound and the falling dollar is providing overseas investors with some extra returns on their stocks and bonds. The Fed just gave the green light to an extra $80 billion in bank/financial stock repurchases last week which will find their way back into higher market valuations for investors. So, while it is prudent to worry about some of the recent stock action in the technology sector, quite often we need the occasional worries to keep the market in check. Enjoy the 4th of July holiday, with or without the lemonade.
Q2 2017 is loaded in the books…
It was the international asset classes that took the rings for U.S. investors. Both Developed (NYSE:EFA)and Emerging Markets (NYSE:EEM) put up 6% quarters while International Bonds also registered solid gains. Small Caps came roaring back for the month of June, even with another terrible performance for the U.S. dollar.
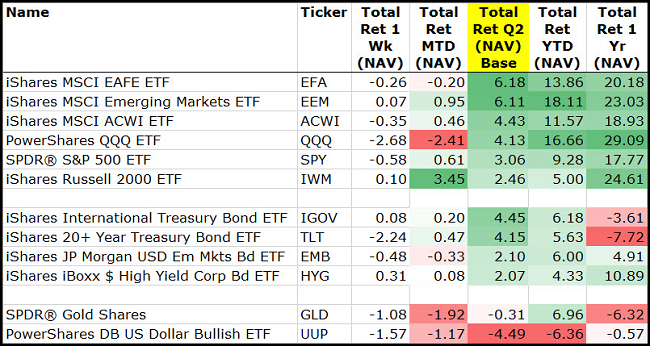
This chart shows the June sell-off in the NASDAQ 100 being mostly an isolated event with little impact on the other major U.S. indexes…

Shifting to the international equity indexes, the Emerging Markets remain the one to catch…

Looking more specifically at International ETFs, they show solid gains in every country YTD except for Russia…
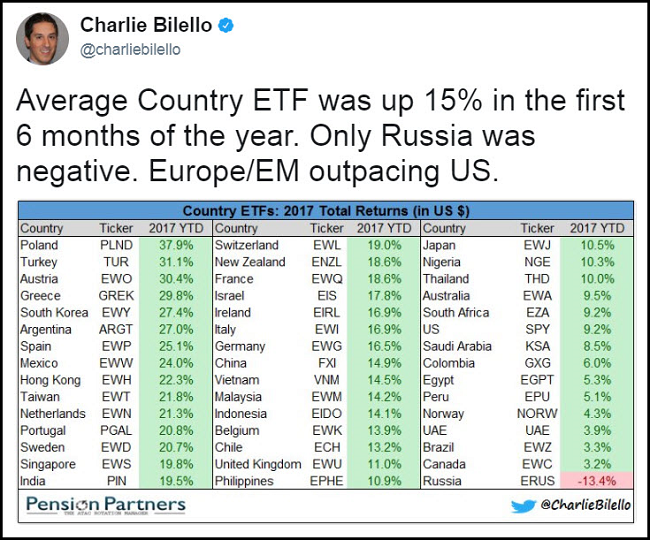
India was one of the best performing large economies. 13D Research doesn’t see much of a slowdown in the future…
India’s estimated domestic consumption growth of 12 percent y-o-y through 2025 is forecast at more than double the global average of 5 percent — poised to triple to $4 trillion by 2025. Rapid urbanization and expansion of India’s middle class is leading to higher disposable income.
McKinsey estimates that India adds three times the population of Los Angeles to its urban populace every year. By 2025, 69 cities in India will each contain over 1 million people, while 49 large cities will account for over three-fourths of India’s economic growth.
A visual of the Sector ETFs shows YTD gains across the board except for Energy…

For Q2, the only losses were found in Energy and for the Gold Miners…
Meanwhile, Biotech (NYSE:XBI) and Healthcare roared back with a vengeance. It will be interesting to see what the market has in store for HealthCare (NYSE:XLV)in the second half. It seems ready to go unless Congress can pull a rabbit out of a hat.
Financials were up 3% last week…
Mostly due to the Fed giving them the green light on their capital plans to raise dividends and accelerate stock buybacks. $80 billion to throw onto the ‘buy’ side of the market is a decent chunk of change.
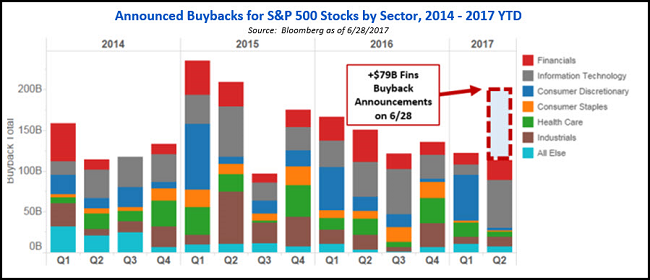
(Bank of America/Merrill Lynch)
And given the recent rise in credit issues at the card companies, buybacks sure beat issuing more cards…
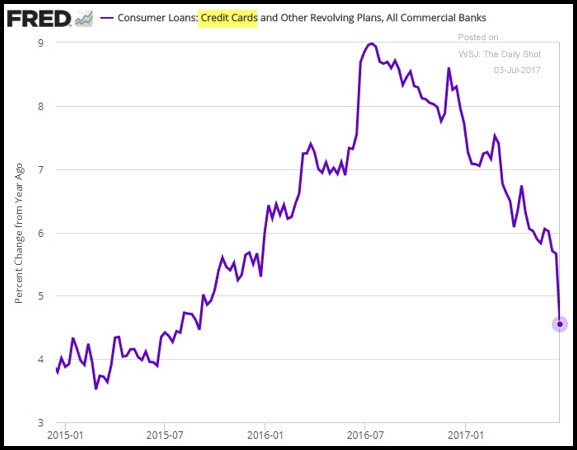
(WSJ/The Daily Shot)
Will Q2 2017 earnings save the day for equities again?
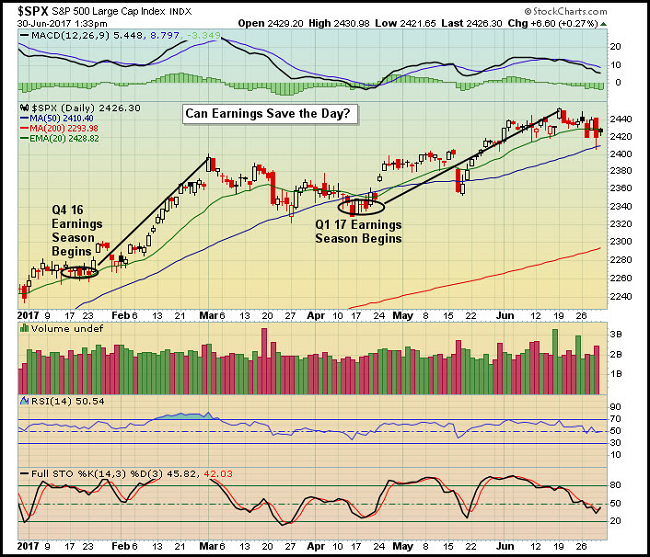
Will the H1 trend continue to persist?
It looks pretty simple to see that a rising market will continue to rise. Of course, it always works that way until you put some money behind it.
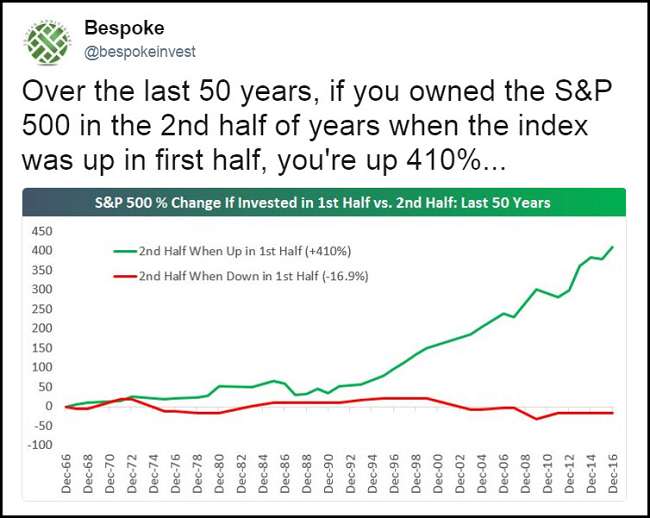
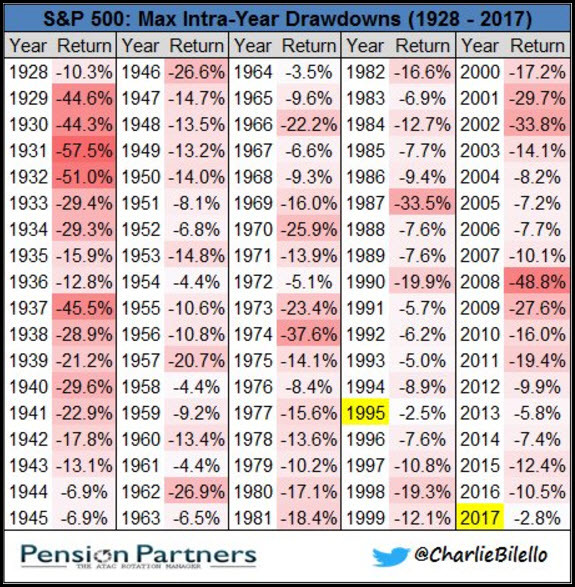
And we are really in need of a pullback…
You need the pullbacks to shake out the loose hands and to set us up for that next leg higher.
A very interesting point in a must-read interview with Bob Rodriguez…
When the markets finally do break, as they always have historically, ETFs and index funds will be destabilizing influences, because fear will enter the marketplace. A higher percentage of assets will be in indexed funds and ETFs. Investors will hit the “sell” button. All you have to ask is two words, “To whom?” To whom do I sell? Index funds and ETFs don’t carry any cash reserves. The active managers have been diminished in size, and most of them aren’t carrying high levels of liquidity for fear of business risk.
We are witnessing the development of a “perfect storm.”
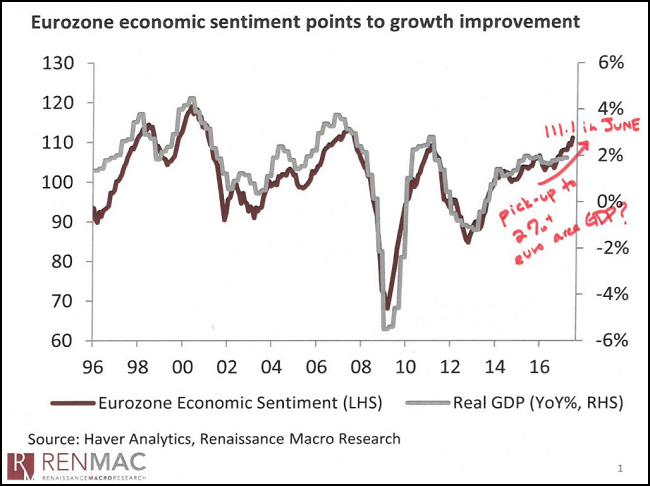
Looking at Europe, could the Eurozone hit 3% GDP growth before the U.S. does?
If so, it would back up the change in sentiment toward tightening at the ECB and Draghi’s comments this week.
Today’s Markit Manufacturing PMI data suggests the direction is up and to the right…
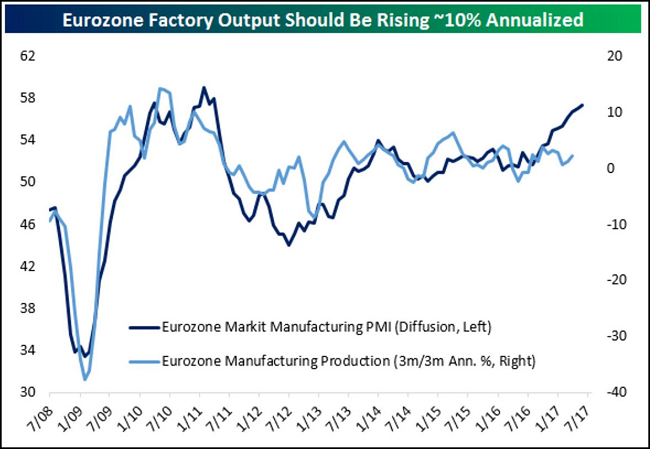
(@bespokeinvest)
The rise in Europe’s data and growth optimism, plus the political failures in Washington D.C., help explain the Euro’s strength and U.S. Dollar’s weakness…
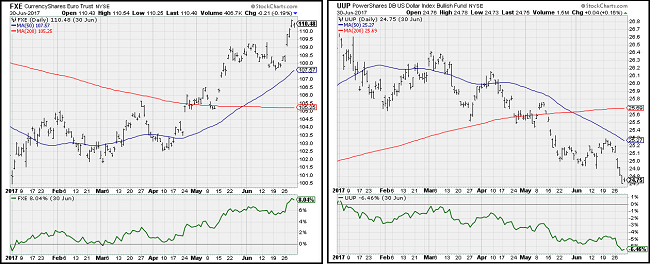
Tough to find a near term catalyst for the U.S. dollar unless Congress gets some wins…
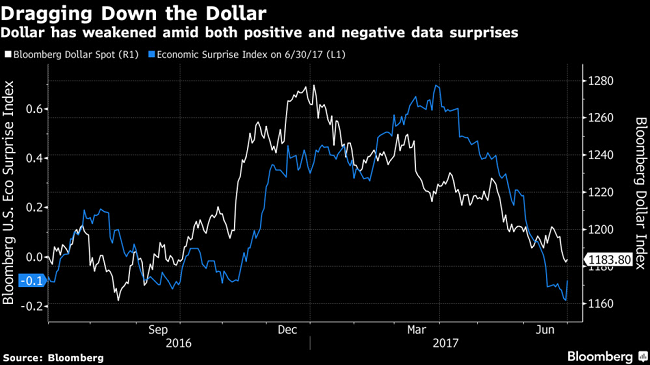
“The dollar has not been responding to positive data surprises, but continues to weaken substantially on negative news,” said Michael Cahill, a strategist at Goldman Sachs (NYSE:GS). “As long as that persists, the risks are skewed to the downside going into every data release.”
The greenback finished the first half on a four month losing streak — the longest such stretch since 2011 — wiping out its post-election gain. The currency’s 6.6 percent decline in the six months through June were the worst half for the dollar since the back end of 2010. Unraveling optimism around the Trump administration’s ability to boost fiscal growth has outweighed Fed policy or positive data, according to Alvise Marino, a strategist at Credit Suisse (SIX:CSGN).
“What’s happening on the monetary policy front is not as important,” said Marino. “It’s more about the dollar remaining weighed down by the unwinding of financial expectations.”
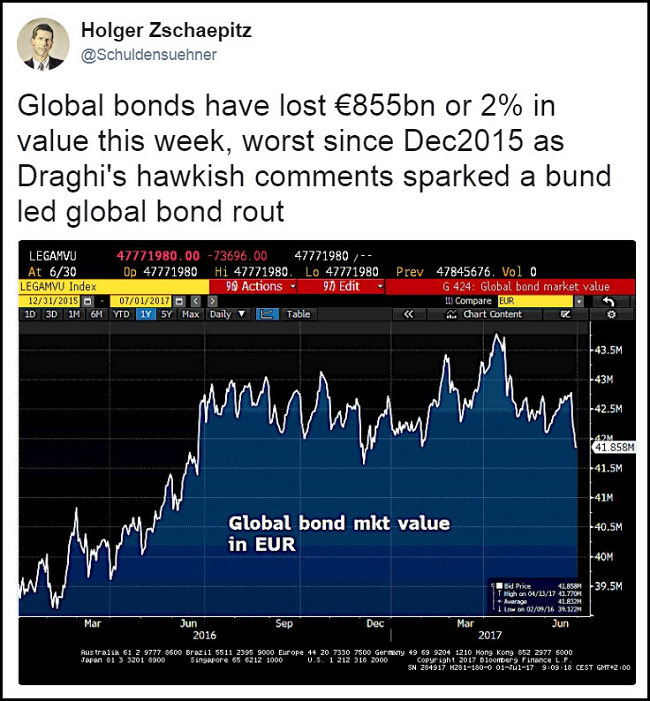
Coordinated comments by the Global Central Bank chiefs sent bond investors under their desks this week…
But in the same week, Apollo raises the largest buyout fund ever…
Apollo Global Management (NYSE:APO) just accumulated the largest single pool of capital earmarked for buyouts, at $23.5 billion. The haul adds to a growing stockpile of dry powder that could make outsized returns harder to come by. With yields so low across most markets, however, it should be easier to make fund investors happy.
Cash is being raised at a rate not seen since 2008. London-based CVC Capital hauled in more than $18 billion for Europe’s largest buyout vehicle earlier this year, Silver Lake pulled together $15 billion for tech deals and KKR set a record in Asia with a $9.3 billion fund while also putting the finishing touches on a $13.9 billion U.S. fund.
With so much money sloshing around, it’s getting harder to imagine how it all will be invested profitably. Research outfit Preqin estimates there’s some $920 billion available in private equity. With leverage, that’s more than $3 trillion to deploy. Apollo itself still has nearly 30 percent of the $18.4 billion fund it raised four years ago to invest, executives said in an analysts’ earnings call in late April.
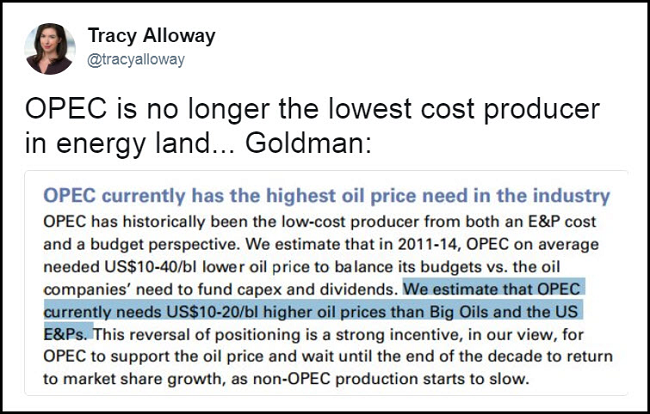
OPEC operators might need to call Apollo…
Have a good book for the beach?
We had some inquiries about a summer book list in recent weeks. I don’t usually put together one summer list as I usually cannot hold back on telling everyone about a great book I’ve recently read.
However, if you are looking for a book, here are a few good lists that others have put together to help with your summer downtime. Many good finds in here including some of my favorites: Against the Gods, Shattered and Ready Player One. If you are a space geek check out How to Make a Spaceship, which I just absorbed.
- J.P. Morgan’s Annual Summer Reading List
- Bill Gates’ Good Summer Reads
- Josh Brown’s Seven Summer Reading Books
- Wall Street Journal – What to Read This Summer
- (New York Times – Books to Breeze Through This Summer
- Barron’s Summer Beach Reading for Investors
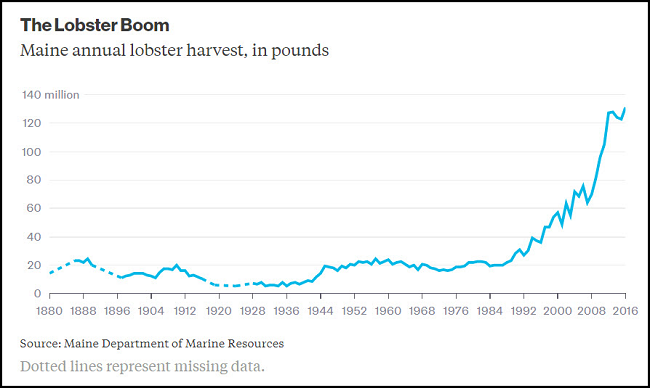
Finally, enjoy your 4th of July lobster today or, better yet, enjoy two of them!
The information presented here is for informational purposes only, and this document is not to be construed as an offer to sell, or the solicitation of an offer to buy, securities. Some investments are not suitable for all investors, and there can be no assurance that any investment strategy will be successful. The hyperlinks included in this message provide direct access to other Internet resources, including Web sites. While we believe this information to be from reliable sources, 361 Capital is not responsible for the accuracy or content of information contained in these sites. Although we make every effort to ensure these links are accurate, up to date and relevant, we cannot take responsibility for pages maintained by external providers. The views expressed by these external providers on their own Web pages or on external sites they link to are not necessarily those of 361 Capital.

