📈 69% of S&P 500 stocks beating the index - a historic record! Pick the best ones with AI.See top stocks

Stocks: Joyful Bounce Today, Tears Tomorrow

Published 02/12/2018, 11:25 AM
Updated 07/09/2023, 06:31 AM
US500
-
DJI
-

Stocks continued the bounce they started last week. On Friday, the SPX rallied into the close, up 86 points from the 2533 low for the day. On Monday morning, the S&P 500 was up as high as 36 points, or 1.4%.

Let’s view this through the lens of cycle analysis. As you can see on the chart below, last week the SPX dove into a projected minor cycle low, which are designated by the purple dotted semicircles at the bottom, called “cycle brackets.” These are guides to cycle patterns.
Daily S&P 500

As we explained in our most recent episode of the askSlim Market Week, it’s normal for a bounce to occur after this type of correction.

However, this move is likely just a bounce. Upon testing the resistance levels between 2652 and 2676, we expect the declining phase of both the minor and major cycles to begin pushing the SPX lower. The major cycles are the green dotted cycle brackets.

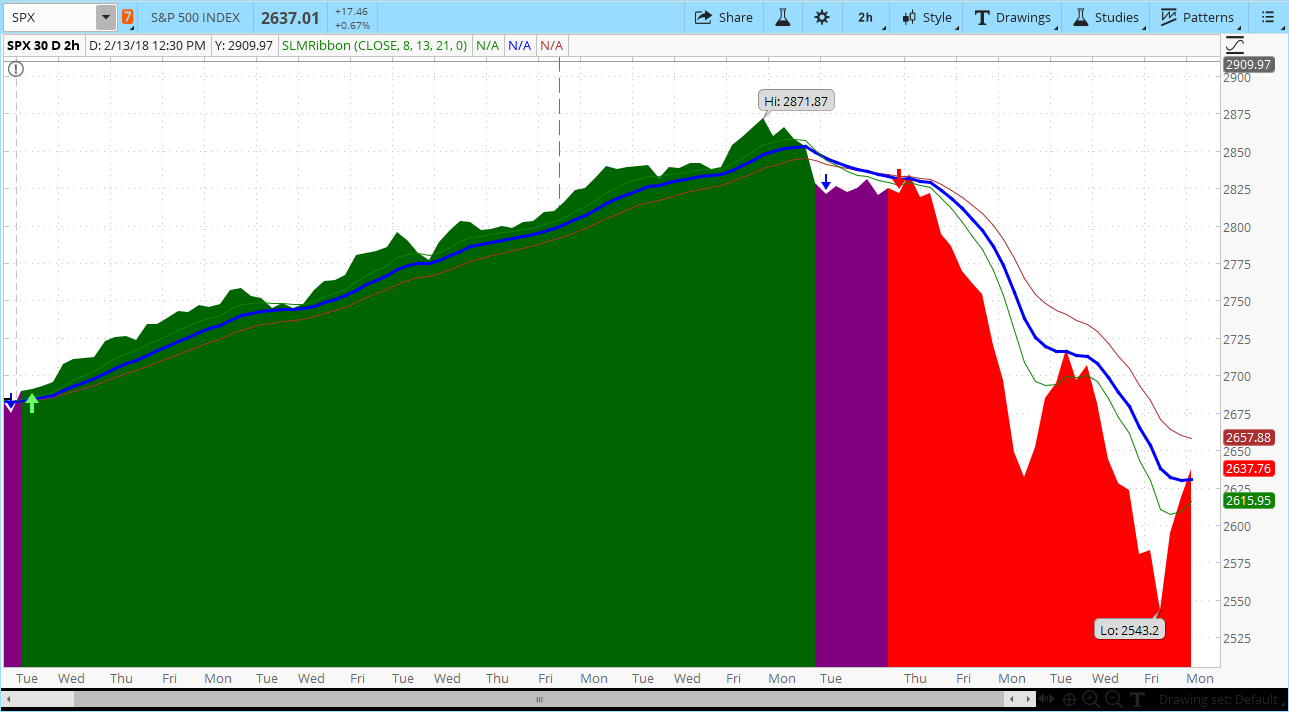
The chart below uses our favorite momentum indicator, “Slim Ribbons,” shown by the red, blue, and green moving averages. This indicates that short-term momentum is still negative, supporting a likely resumption to the downside.
2-Hour SPX Chart Over 30 Day Period

Taking a step back, our analysis of longer term cycles suggests that this is just the first leg of a declining phase of a larger cycle. In a clip from our member video below, we look at the monthly chart of the Dow Jones Industrial Average (DJI), which suggests that we are in period that could take the market lower into May, June, and July of 2018.

Visit our site for more on our approach to using market cycles to analyze stocks.

Latest comments

Loading next article…
Risk Disclosure: Trading in financial instruments and/or cryptocurrencies involves high risks including the risk of losing some, or all, of your investment amount, and may not be suitable for all investors. Prices of cryptocurrencies are extremely volatile and may be affected by external factors such as financial, regulatory or political events. Trading on margin increases the financial risks.
Before deciding to trade in financial instrument or cryptocurrencies you should be fully informed of the risks and costs associated with trading the financial markets, carefully consider your investment objectives, level of experience, and risk appetite, and seek professional advice where needed.
Fusion Media would like to remind you that the data contained in this website is not necessarily real-time nor accurate. The data and prices on the website are not necessarily provided by any market or exchange, but may be provided by market makers, and so prices may not be accurate and may differ from the actual price at any given market, meaning prices are indicative and not appropriate for trading purposes. Fusion Media and any provider of the data contained in this website will not accept liability for any loss or damage as a result of your trading, or your reliance on the information contained within this website.
It is prohibited to use, store, reproduce, display, modify, transmit or distribute the data contained in this website without the explicit prior written permission of Fusion Media and/or the data provider. All intellectual property rights are reserved by the providers and/or the exchange providing the data contained in this website.
Fusion Media may be compensated by the advertisers that appear on the website, based on your interaction with the advertisements or advertisers.
© 2007-2024 - Fusion Media Limited. All Rights Reserved.