The anticipated sell-off in the US bond market has played out well so far, with UST10z gaining a sizeable 10 basis points and settling at 2.50%. Although, we are seeing signs of buyers in Asia today and both nominal and ‘real’ UST10yr yields are 3bp lower.
The now universally watched UST 3m10y curve steepened by a massive 11bp yesterday, and out of the inversion, although traders have been keen to jump back into ‘flatteners’ today, and we see the curve flatter by 5bp through Asian trade. This sort of move gives us a belief that the scope for a steeper yield curve is limited.
The improvement seen in China’s PMI series yesterday gave us a warm fuzzy feeling and this was given new wind with US manufacturing ISM pushing above consensus to 55.3, while construction spending gained 1%. This data offset another weak US retail sales report, although there were some positive revisions to the January retail numbers and ultimately, we saw the Atlanta Fed Q1 GDP nowcast model pulled up 41bp to 2.12%. USD/JPY has pushed into the 200-day MA at 111.48, benefiting from the move in US yields, while it’s also worth pointing out we have seen a reasonable re-pricing in the US rates market, with 15bp of cuts for 2020 priced out of the market over the past few days.
The tape in the S&P 500 was a thing of beauty, with the cash index opening at its lows and closing towards the highs – it’s not just about how a market goes from A to B, but the overall quality of the journey is so important. Breadth was ok, with 78% of stocks higher on the day, led by financials who responded as one would expect to the steeper yield curve. The cyclical/defensive sector ratio increased by 1.8%, and the second-best day of the year. Granted, volumes were 5% below the 30-day average and could have been better, and one would have liked small caps to outperform the Russell closed +1%), but the bulls are in control of the equity market for now, and the prospect of new all-time highs in the S&P 500 is still on the cards.
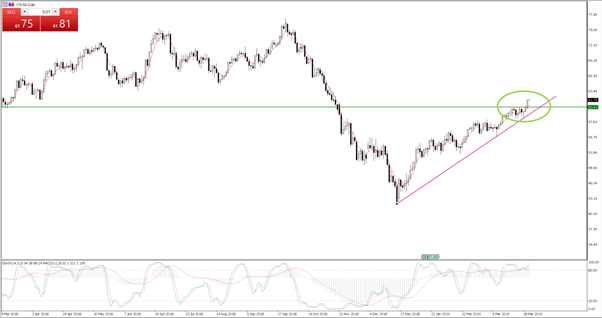
US crude into $61.80 is helping sentiment, and again the breakout of the recent highs of $60.39 is naturally bullish, with the uptrend giving us little reasoning to be short here. The moves in the barrel are also helping a strong performance in the HY (high yield) /IG (investment-grade) credit spread, which continues to narrow and which loops into higher equity prices.

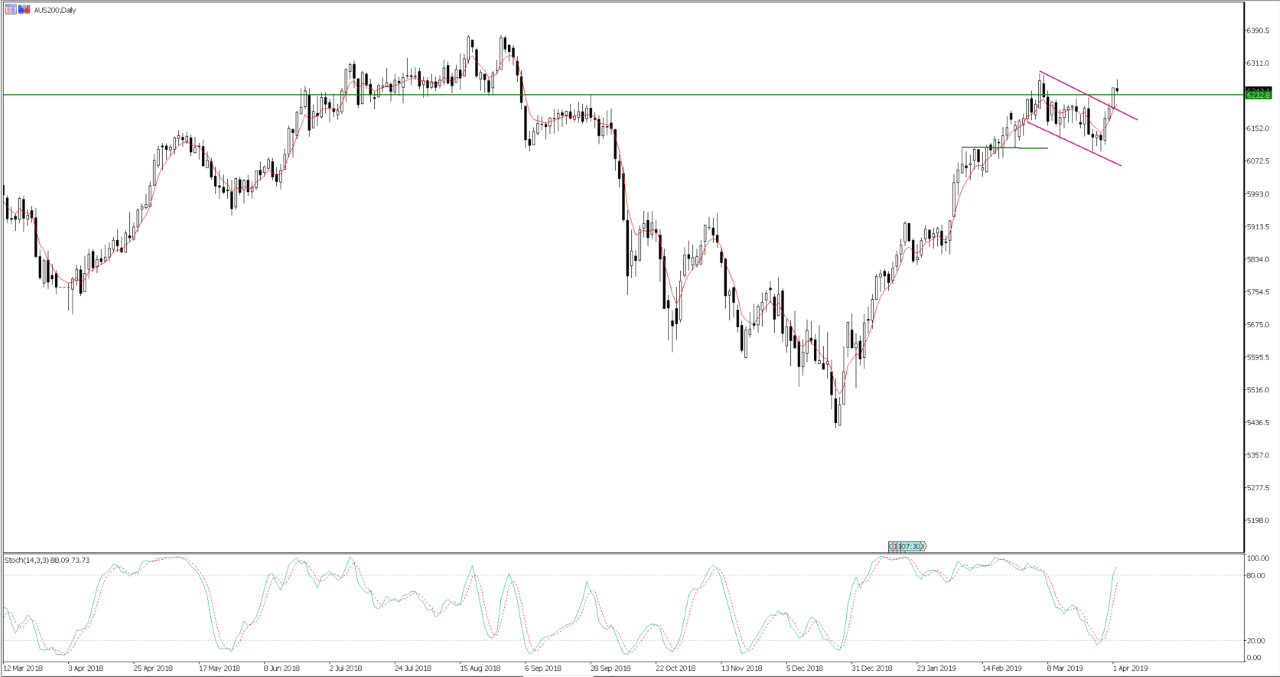
Asia has opened the new day on a predictably positive note, with Australia leading the charge, although whippy price action in China has influenced the Aussie market. Notably through mid-session, where we saw better sellers in the ASX 200. The daily chart of the ASX 200 still looks bullish, and price action is providing a belief that if we see FOMO in the US, then we also see it play out in Oz. The break of the bull flag was noted yesterday by many, and this is playing out well. We had the chance to pull below the 28 September high, and the buyers have waded in, and at this time the index is sitting just above the mid of today's trading range (6270 to 6217). We eye the 7 March high of 6270, for a move into 6300.
ASX 200 daily

The highlight of the day was clearly the RBA meeting and the market has reacted to a subtle change in the final paragraph, with the bank detailing “The Board will continue to monitor developments and set monetary policy to support sustainable growth in the economy and achieve the inflation target over time.” The bank has provided themselves flexibility to cut, and can change the language more intently in May, with further emphasis on labour market reads. Thus, the market should become far more sensitive to data points such as ANZ job ad’s (8 April), job vacancies (24 April), capacity utilisation (14 May) and, of course, the ABS employment number (18 April). If it's important to the RBA, its important to traders.
In the FX space, the early mover that came onto the radar was GBP, where the UK Commons voted down all four motions again in indicative votes. GBPUSD fell a lazy 80-odd pips, but held Friday’s close at 1.3035, with buyers bravely stepping back in. We look for any commentary from tonight’s cabinet meeting, ahead of Wednesday's next round of further concentrated indicative votes. However, needless to say, a new tactical approach from Theresa May and her cabinet has to be found to compel the EU Council on 10 April.
It certainly won’t shock to detail that implied volatility in GBP/USD, expiring 15th April, is elevated, with an expected move over this period of some 360-pips, but even this move seems low in the scenario where a no deal Brexit becomes a reality. The market is still seemingly of the belief that a soft Brexit is the higher probability, with a higher relative chance Article 50 is actually withdrawn than we head towards a hard Brexit. However, the path over the next few days is highly strategic, with a view we could see a showdown between May’s deal, a customs union model or a second referendum soon. A general election needs to be avoided at all costs, as the Tory party look broken and unelectable, and that’s even if the Tory party have a new leader into a general election. May needs to pull a rabbit out of the hat here, or Brexit will move from a local issue into one that could inspire greater volatility in global markets.
