🐂 Not all bull runs are created equal. November’s AI picks include 5 stocks up +20% eachUnlock Stocks

This Week In The S&P 500: A Bounce Sets Up a Drop

Published 08/14/2017, 08:28 AM
Updated 07/09/2023, 06:31 AM
XAU/USD
-
US500
-
AAPL
-
GC
-


The S&P 500 (SPX) had what has become a rare decline, last week, losing 35 points to 2441. Stocks fell in part due to tensions between North Korea and the United States and in part due to an excessively overbought market and corrective market cycles playing out. And headlines are not getting much better this week with the violence in VA and the demonstrations around the country.

Last week, on Monday, Fed head James Bullard opined that there is no need to raise interest rates, which pushed stocks up. The momentum continued Tuesday, as Apple (NASDAQ:NASDAQ:NASDAQ:AAPL) hit a record high of $261.83. However, later that day, President Donald Trump vowed to respond with “fire and fury” if North Korea continued to threaten the United States. This produced an intraday reversal of 17 points in the S&P 500, in a classic reversal day. Our work suggests that high will be a significant chart point moving forward.

On Wednesday, stocks bounced during US trading hours, as gold and bonds also rose in a safety bid. But world stocks tumbled again in Thursday’s Asian trading session as Kim Jong Un threatened to fire missiles “near” the US territory of Guam. In response, the SPX fell 36 points, or 1.5%. The decline hit our targets for the week, almost spot on. Friday, stocks bounced modestly in response to weaker inflation data.

The question is will the bounce continue or is there more downside? Our work in analyzing market cycles in the SPX points to further declines. We believe bounces will be met with additional selling and further sharp drops lie just ahead. Intermediate patterns suggest weakness likely continuing through late August or early September. The accompanying chart illustrates our cycle projections, with the blue dotted half circles representing the short-term cycle patterns.

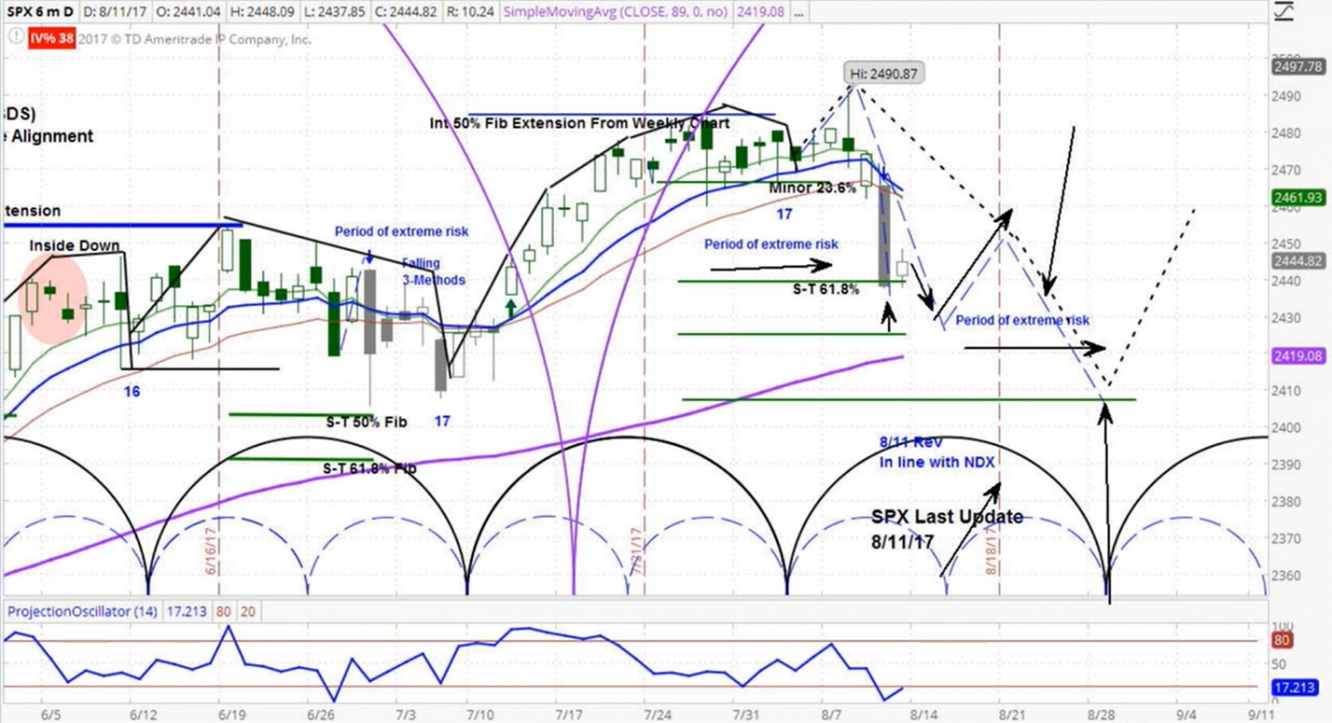
Daily chart for the S&P 500 (SPX)

Latest comments

Loading next article…
Risk Disclosure: Trading in financial instruments and/or cryptocurrencies involves high risks including the risk of losing some, or all, of your investment amount, and may not be suitable for all investors. Prices of cryptocurrencies are extremely volatile and may be affected by external factors such as financial, regulatory or political events. Trading on margin increases the financial risks.
Before deciding to trade in financial instrument or cryptocurrencies you should be fully informed of the risks and costs associated with trading the financial markets, carefully consider your investment objectives, level of experience, and risk appetite, and seek professional advice where needed.
Fusion Media would like to remind you that the data contained in this website is not necessarily real-time nor accurate. The data and prices on the website are not necessarily provided by any market or exchange, but may be provided by market makers, and so prices may not be accurate and may differ from the actual price at any given market, meaning prices are indicative and not appropriate for trading purposes. Fusion Media and any provider of the data contained in this website will not accept liability for any loss or damage as a result of your trading, or your reliance on the information contained within this website.
It is prohibited to use, store, reproduce, display, modify, transmit or distribute the data contained in this website without the explicit prior written permission of Fusion Media and/or the data provider. All intellectual property rights are reserved by the providers and/or the exchange providing the data contained in this website.
Fusion Media may be compensated by the advertisers that appear on the website, based on your interaction with the advertisements or advertisers.
© 2007-2024 - Fusion Media Limited. All Rights Reserved.