🐂 Not all bull runs are created equal. November’s AI picks include 5 stocks up +20% eachUnlock Stocks

This Measure Of U.S. Equity Volatility Is At A 22-Year Low

Published 07/25/2017, 06:36 AM
Updated 07/09/2023, 06:31 AM
US500
-
VIX
-

On a range of trends and topics these are unusual times we live in, and stock market volatility is no exception. As a matter of fact, market volatility in general is very low i.e. across asset classes, as discussed in the latest weekly report. Yet here is a somewhat unusual measure of volatility, which is coming in at a 22-year low.

The indicator (red line in the first chart below) shows the running annual count of daily changes in the S&P 500 that exceeded positive or negative 1%. To clarify, if the market was up e.g. 1.3% that would be counted, likewise if the market was down -1.4% for example it would also be counted.

Up to Friday's close, the past year had precisely 13 days where the S&P 500 moved by more than 1% in either direction. It was very briefly lower than that in December 1995. So it's fair to say that based on this alternative view that volatility is extremely low.

But so what? Well, typically when it gets this extremely low it doesn't stay low for long, but this measure of volatility can rise in a more euphoric/erratic bull market (e.g. the late 90's) or a bear market (e.g. leading into the financial crisis). Either way it's one to have on your radar as a turn in this indicator can give a lead on a change in market regime.

The running annual count of daily moves in the S&P 500 exceeding +/- 1% has dropped to 13, which is the lowest reading in 22 years, and is indicative of extremely low volatility.
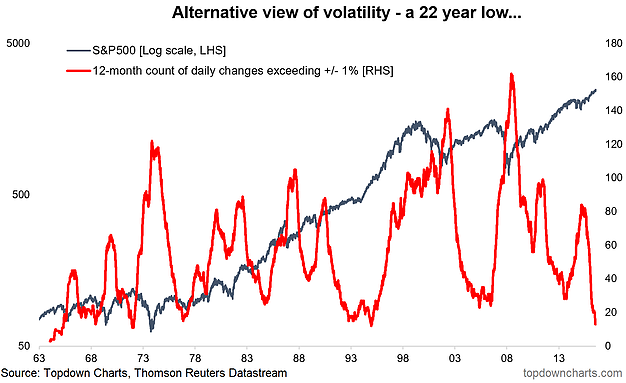
Alternative View Of Volatility A 22 Year Low

Even if you look at the same indicator using a threshold of 0.50%, volatility looks low – in fact with that criteria you have to go back to the 60's to find lower levels of volatility.
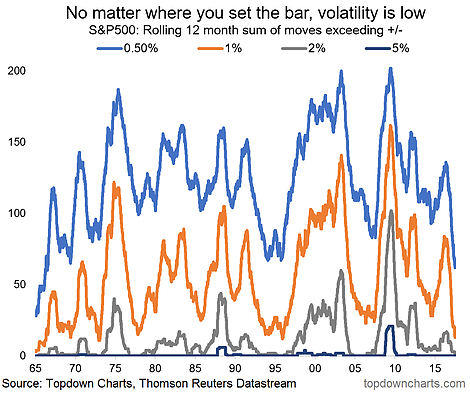
S&P 500 Rolling 12 Month

Latest comments

Loading next article…
Risk Disclosure: Trading in financial instruments and/or cryptocurrencies involves high risks including the risk of losing some, or all, of your investment amount, and may not be suitable for all investors. Prices of cryptocurrencies are extremely volatile and may be affected by external factors such as financial, regulatory or political events. Trading on margin increases the financial risks.
Before deciding to trade in financial instrument or cryptocurrencies you should be fully informed of the risks and costs associated with trading the financial markets, carefully consider your investment objectives, level of experience, and risk appetite, and seek professional advice where needed.
Fusion Media would like to remind you that the data contained in this website is not necessarily real-time nor accurate. The data and prices on the website are not necessarily provided by any market or exchange, but may be provided by market makers, and so prices may not be accurate and may differ from the actual price at any given market, meaning prices are indicative and not appropriate for trading purposes. Fusion Media and any provider of the data contained in this website will not accept liability for any loss or damage as a result of your trading, or your reliance on the information contained within this website.
It is prohibited to use, store, reproduce, display, modify, transmit or distribute the data contained in this website without the explicit prior written permission of Fusion Media and/or the data provider. All intellectual property rights are reserved by the providers and/or the exchange providing the data contained in this website.
Fusion Media may be compensated by the advertisers that appear on the website, based on your interaction with the advertisements or advertisers.
© 2007-2024 - Fusion Media Limited. All Rights Reserved.