Selloff or Market Correction? Either Way, Here's What to Do NextSee Overvalued Stocks

VIX At A Seasonal Turning Point

Published 07/13/2017, 12:06 AM
Updated 07/09/2023, 06:31 AM
US500
-
VIX
-

The topic of seasonality is a controversial one among investors. Some swear by it, referring to studies that present evidence for a reliable seasonal pattern across the year, verified across global equity markets. Others dismiss it as noise; nothing but a random assembly of outliers - or ignore it due to a lack of reliability.

Whatever your view is, the historical averages, the numbers, the data, appear to show a distinct pattern. And while you can often get lost or deceived in the averages, the chart below shows that July (i.e. now) is the turning point for stock market returns and volatility.

The historical seasonal pattern is that the VIX (implied volatility) tends to rise on average from July through October. The second chart shows, much as you would expect, that the stock market itself is typically weak through that period also.

The rule of thumb for seasonality is you don't want to rely on it, but incorporate it as one factor among many into your investment process. For example, if you said S&P 500 valuations are expensive, the Fed is hiking rates, lending standards have tightened somewhat, sentiment is increasingly bullish, and there are a few geopolitical risks lurking in the shadows...and then pointed to the negative seasonality that has historically characterized the July-October period, you might come to a conclusion that the risk of a correction is elevated short term.

Here's how the VIX is trading so far during 2017 vs the historical average level from 1990-2016. Typically July is the seasonal turning point.
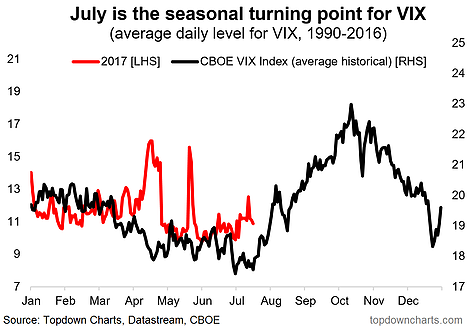
VIX Seasonality 2017:Historical Average

Putting it into context with the S&P 500 itself, here's the stock market risk vs return seasonality map.
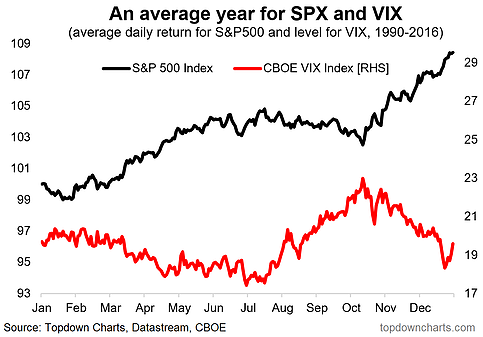
SPX:VIX Seasonality

Latest comments

Loading next article…
Risk Disclosure: Trading in financial instruments and/or cryptocurrencies involves high risks including the risk of losing some, or all, of your investment amount, and may not be suitable for all investors. Prices of cryptocurrencies are extremely volatile and may be affected by external factors such as financial, regulatory or political events. Trading on margin increases the financial risks.
Before deciding to trade in financial instrument or cryptocurrencies you should be fully informed of the risks and costs associated with trading the financial markets, carefully consider your investment objectives, level of experience, and risk appetite, and seek professional advice where needed.
Fusion Media would like to remind you that the data contained in this website is not necessarily real-time nor accurate. The data and prices on the website are not necessarily provided by any market or exchange, but may be provided by market makers, and so prices may not be accurate and may differ from the actual price at any given market, meaning prices are indicative and not appropriate for trading purposes. Fusion Media and any provider of the data contained in this website will not accept liability for any loss or damage as a result of your trading, or your reliance on the information contained within this website.
It is prohibited to use, store, reproduce, display, modify, transmit or distribute the data contained in this website without the explicit prior written permission of Fusion Media and/or the data provider. All intellectual property rights are reserved by the providers and/or the exchange providing the data contained in this website.
Fusion Media may be compensated by the advertisers that appear on the website, based on your interaction with the advertisements or advertisers.
© 2007-2024 - Fusion Media Limited. All Rights Reserved.