Michael Kramer and the clients of Mott Capital Own Netflix (NASDAQ:NFLX) and Tesla (NASDAQ:TSLA)
S&P 500 (SPY (NYSE:SPY), SP500)
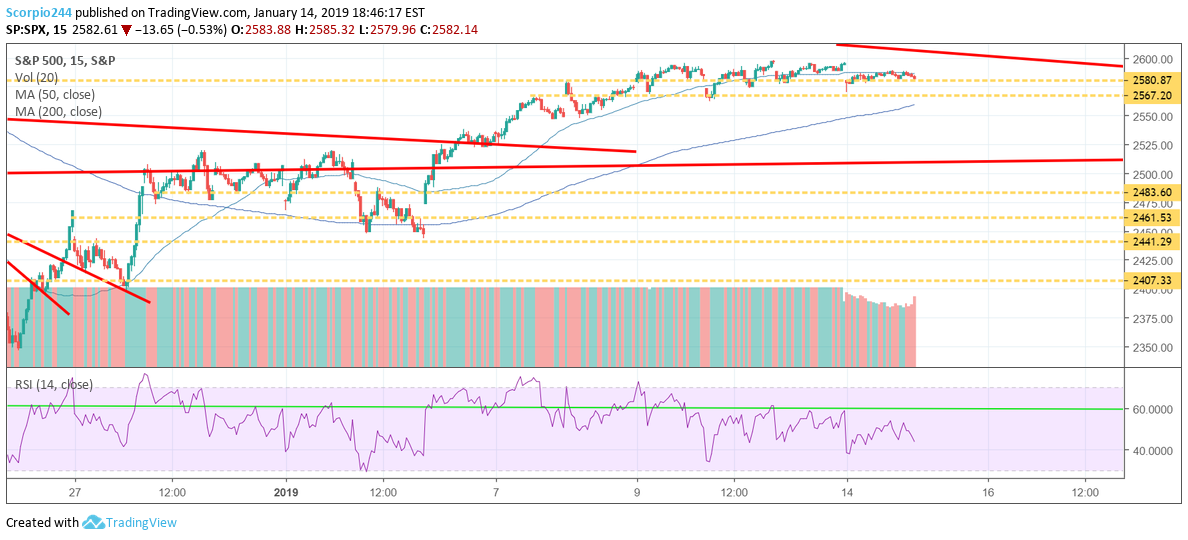
The stock market dropped on January 14 with the S&P 500 falling by 53 basis points, certainly nothing severe. The good news is that the index managed to hold support firmly at 2,580. There is a risk for further downside to the index, with the next level coming around 2,567.
Russell 2000 (RUT, IWM)
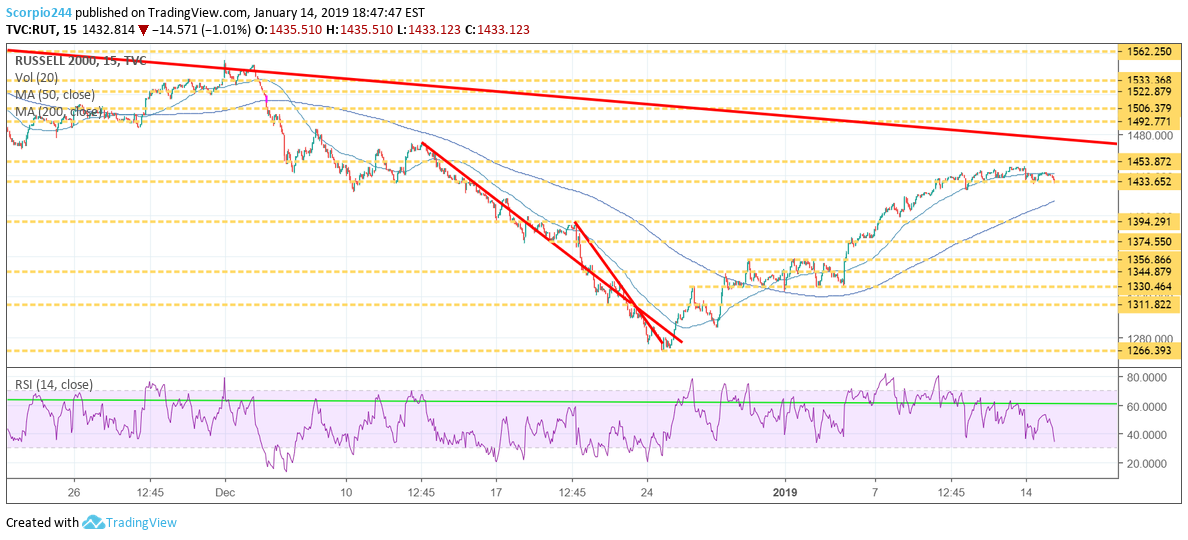
The Russell is holding support around 1,433, and downside for this index appears to be around 1,418.
Housing Sector (HGX)
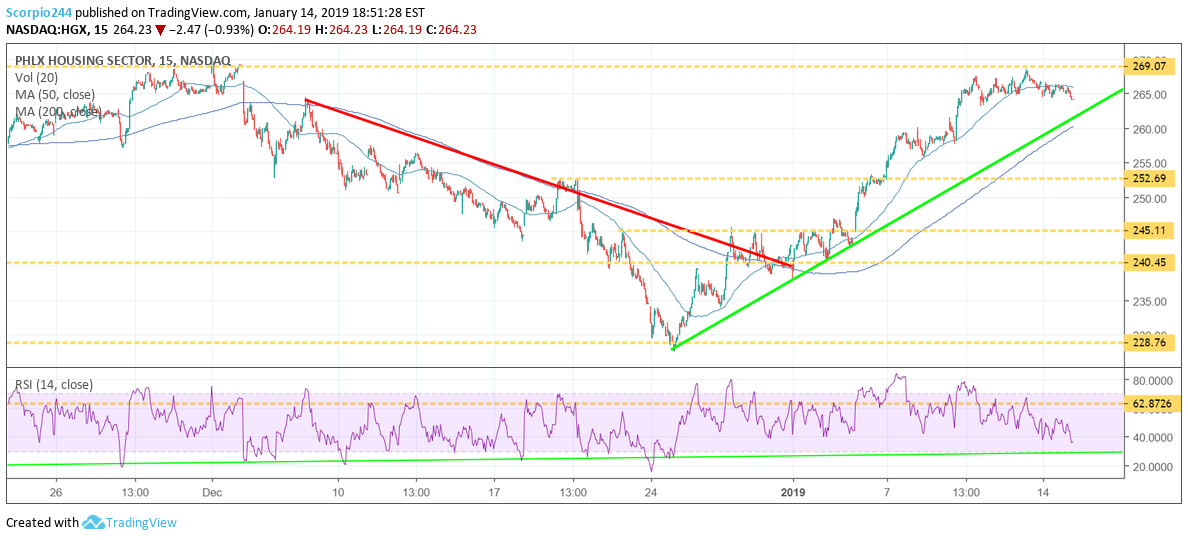
The PHLX Housing is hanging in, despite a weak looking chart. The trend is still higher, but a break out likely doesn’t happen tomorrow.
General Motors (NYSE:GM)
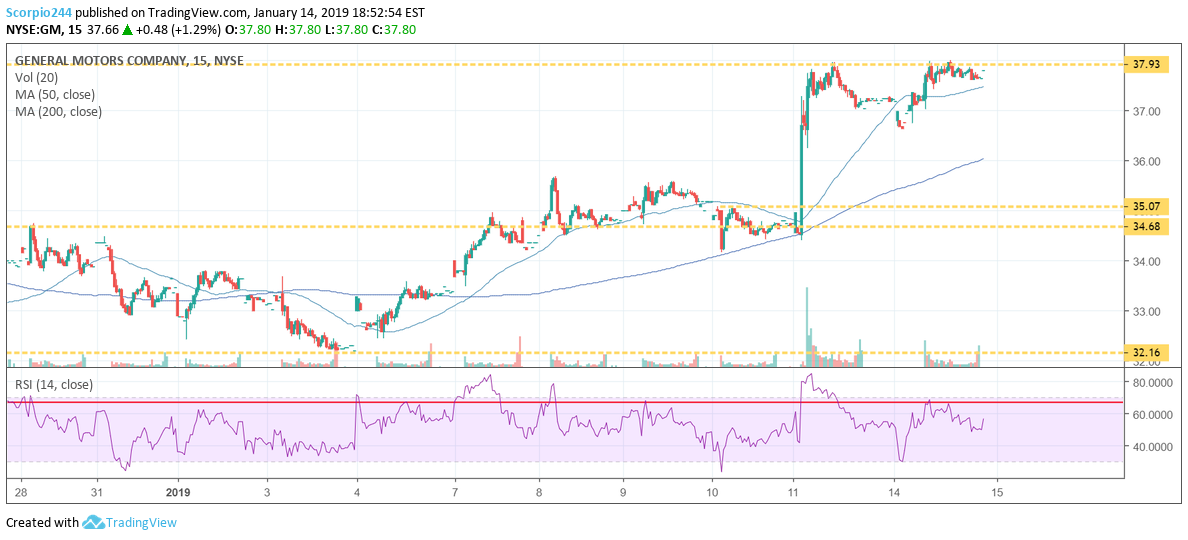
General Motors once again got to $38 today and still failed. The chart would suggest to me its falls back to around $35. I wrote a commentary in the premium area about some bearish options activity. Investors Seem Skeptical On GM
Roku
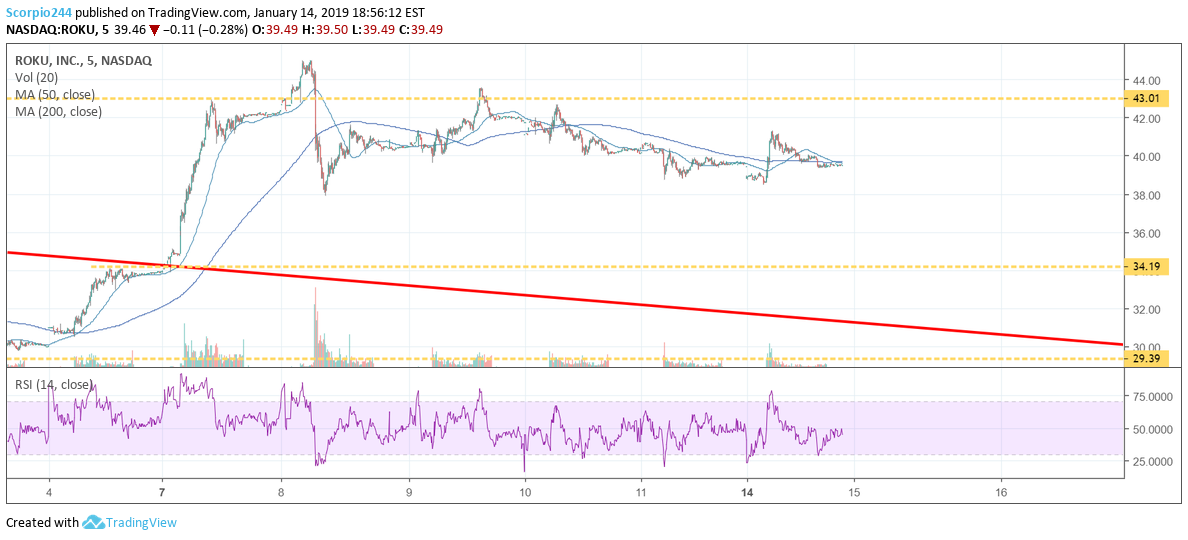
Roku Inc (NASDAQ:ROKU) is not looking great. The stock gapped higher, worked its way lower all day finally filling the gap and giving all its early gains away. The stock surely doesn’t act like a stock that is going higher. I still see $34 in the future.
Netflix (NFLX)
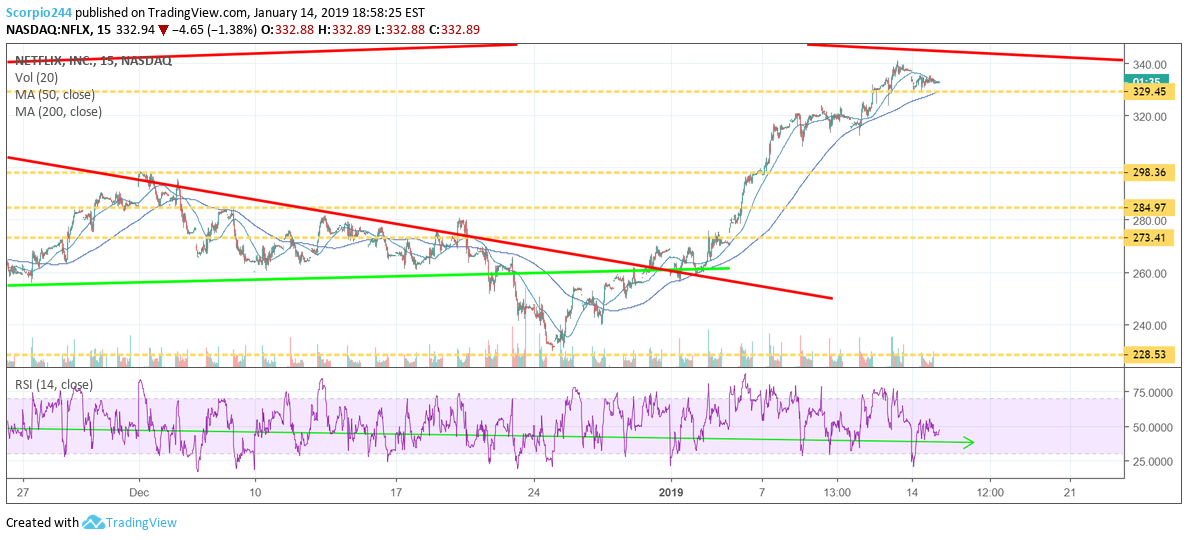
Netflix Inc (NASDAQ:NFLX) is holding steady with earnings on the way. $332 continues to be support, and I think as long as that level holds the stock’s path of least resistance is higher, with $355 acting as the next level of resistance.
Citigroup (NYSE:C)
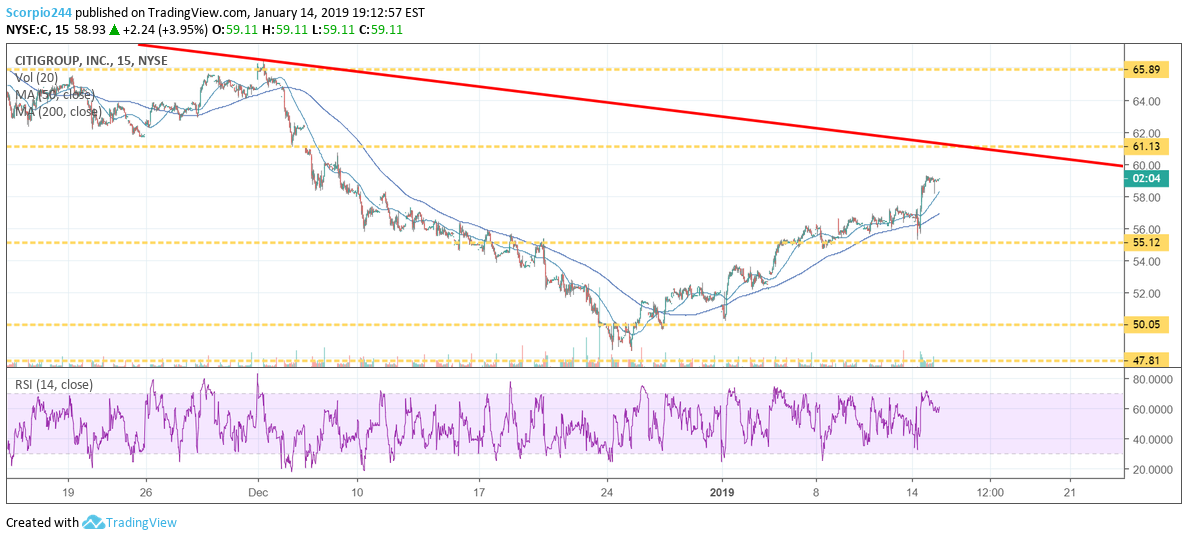
Citigroup was up today despite reporting revenue that missed estimates. The big hit for the company came from a stunning 21% drop in fixed income revenue versus the same period a year ago. Should the weakness from the fixed income unit be a surprise? Citigroup told us in December that they were expecting fixed-income trading to be down year-over-year.
This stock is down so much that I have a feeling that much of today’s news was already factored in. I noted yesterday the stock could rise to around $61. That still looks like it may very well be the case.
Bank of America (NYSE:BAC)
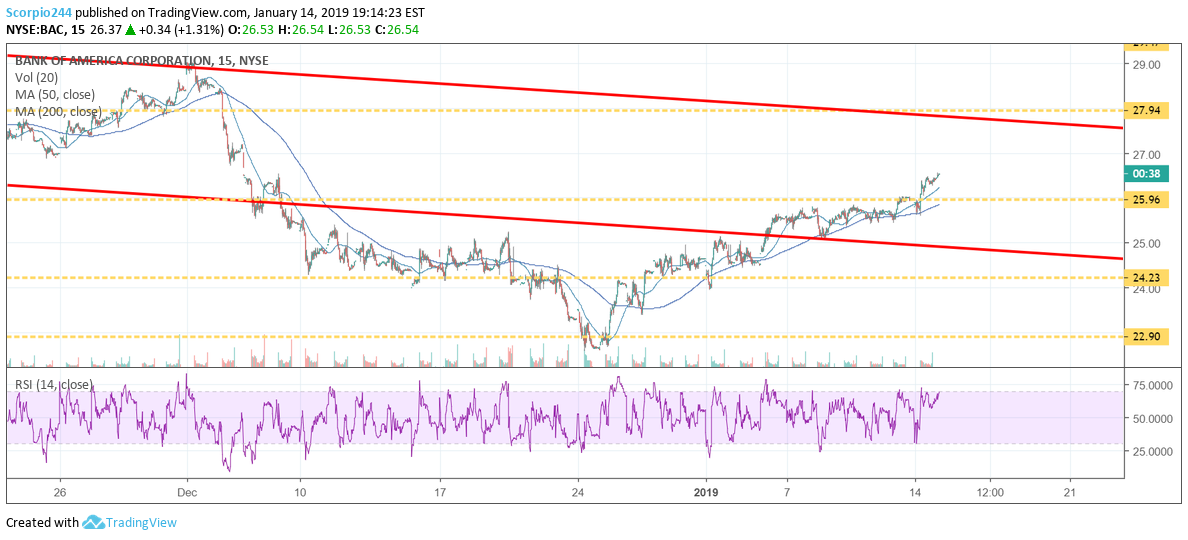
Bank of America cleared a significant hurdle today rising above $26, and as I said yesterday, I think this one is still on its way higher to around $28. The company reports on Wednesday.
Tesla (TSLA)
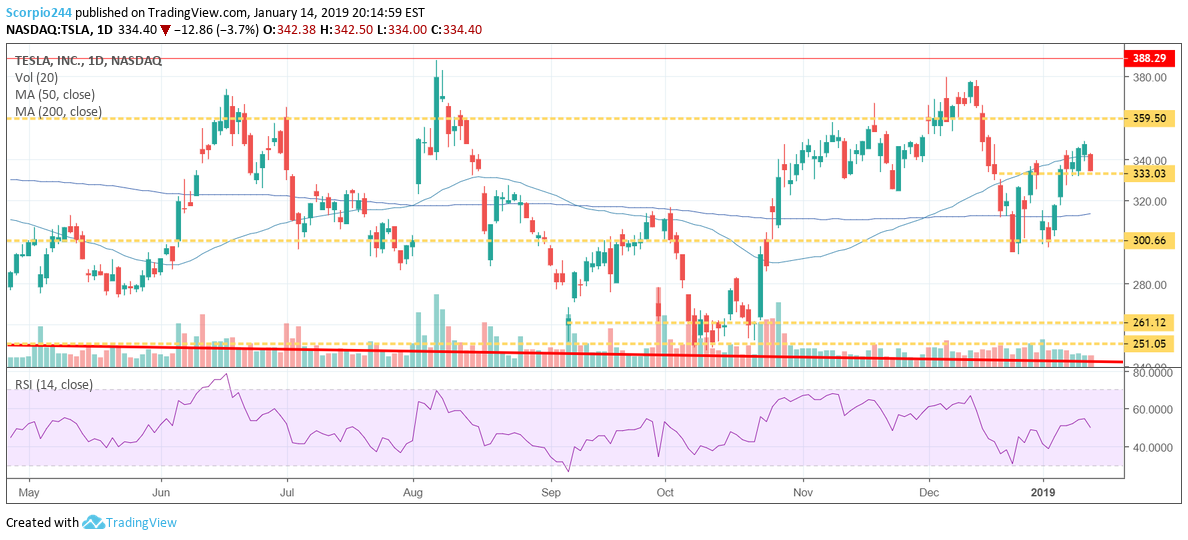
I’m not sure what weighed on Tesla Inc (NASDAQ:TSLA) so much today? The stock fell pretty sharply on very little news, at least from what I could tell? Some attributed the weakness from commentary out of the Detroit auto show, while others blamed some bearish commentary from Muddy Waters about the stock’s valuation.
I’m not sure what the right answer is, and in this case, I don’t think there is an “answer.” The stock has been in a range of $300 and $360 for a very long time — nothing new here.
Sometimes stocks go down just because there is a seller.

