Back on October 29, 2014, the Federal Reserve ended its largest round of quantitative easing (QE3/QE4). The unconventional policy of buying market-based assets with electronically created credits (dollars) first began in late November of 2008. Since that time, $3.75 trillion in stimulus forced interest rates downward and sent stock prices soaring. The S&P 500 moved from 857.39 when QE1 was first announced to 1982.30 when QE3/QE4 ran its course for an approximate gain of 131%.
Equally intriguing, when the Fed backed away from its asset purchasing rate manipulation, stocks struggled mightily. The S&P 500 fell 16% in a sharp pullback shortly after the end of QE1. What’s more, in the period between QE1 and QE2, stocks essentially experienced flat returns.
The same phenomenon occurred shortly after the end of QE2. The S&P 500 fell 19.4% in a bearish sell-off. It wasn’t until the Fed began selling short-term Treasury bonds and buying longer-term Treasury bonds that investors regained confidence in late 2011. Moreover, the period between the end of QE2 and the start of QE3/QE4 yielded very little in the way of gains.
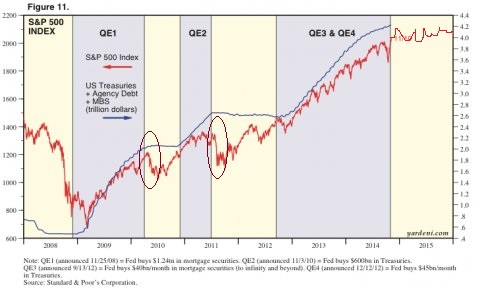
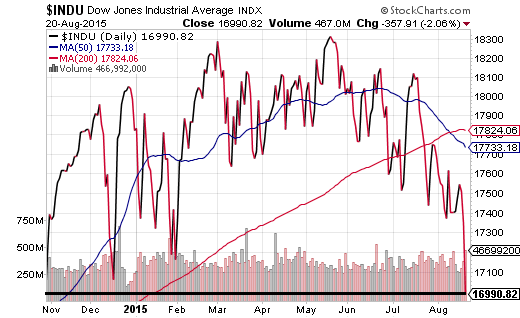
Perhaps it should come as no surprise that – since October 29th of last year when QE3/QE4 ended – the S&P 500 has garnered a modest 2.7%. Other areas of the U.S. stock market have had less success. The iShares Dow Jones Transportation ETF (NYSE:IYT) has already corrected nearly 11% since the end of QE3/QE4, while the Dow Jones Industrials is in the same place that it started.
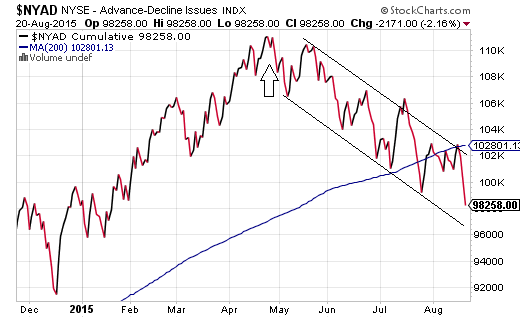
As I described in Tuesday’s ‘Market Top? 15 Warning Signs’ – as I discussed in numerous articles throughout May, June and July – extremely overvalued stocks and deteriorating stock market breadth create an unsavory concoction. Mix in a central bank that expresses a desire to hike borrowing costs when the global economy is decelerating, commodities are plummeting and credit spreads are widening, and even the mightiest success stories begin to get victimized.
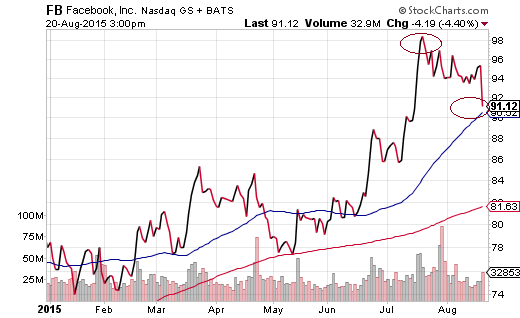
Time and again, history has shown that when more and more sectors are falling apart, the pressure on the remaining sectors becomes overwhelming. Energy, materials, industrials, transportation – decliners have been pressuring advancers since the beginning of May. Granted, one may wish to pay a premium price for earnings growth in Disney (NYSE:DIS), Facebook (NASDAQ:FB) and Netflix (NASDAQ:NFLX). On the other hand, when the number of advancing stocks participating in the bull market continues to diminish (relative to decliners), even the most popular momentum stocks eventually witness a mad dash for the exits.
I am not suggesting that investors should abandon all of their risk assets. On the flip side, history tends to validate the adage, “the further they climb, the harder they fall.”
The media can try to pin all of the blame on China’s turmoil. As a catalyst, sure. Yet S&P 500 corporations with valuations at the 2nd highest levels in history are struggling to report earnings growth. Worse yet, revenues have declined for two consecutive quarters. If fundamentals matter, shouldn’t one expect some reversion to average price-to-sales ratios and/or average market cap-to-GDP ratios?
And then there’s the global economy. Currency devaluation throughout Asia, Latin America and Europe certainly haven’t helped the 50% of profits that are generated by S&P 500 corporations abroad. Worse yet, the London Interbank Offered Rate, or LIBOR, has been rising for the better part of the last 12 months. Might this suggest that banks in the UK (as well as banks that use LIBOR for mortgages) are growing concerned about lending to one another? Does it hint that the world’s reliance on central banks to keep rates unbelievably low is now in danger of creating another credit crisis?
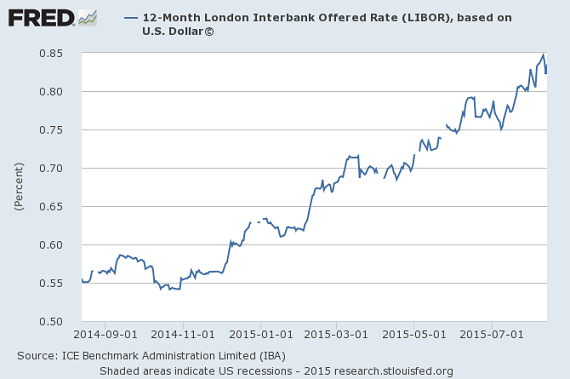
From my vantage point, the evidence that has been building up for several months has strongly favored reducing the risk of loss in one’s portfolio. Should you run for the hills? No. Yet I continue to favor large-caps over small-caps, domestic over foreign. I continue to favor treasuries and investment grade over higher yielding bonds.
Most importantly, I have been systematically raising the cash level in client accounts for months. 20%, 25%, 30%, depending on client risk tolerance. Having that cash gives my clients the opportunity to buy high quality stocks at more attractive prices when a pullback, 10%-plus correction, or 20%-plus bear shows signs of abating. Specifically, when market internals/breadth as well as valuations improve, cash will be redeployed.
Disclosure: Gary Gordon, MS, CFP is the president of Pacific Park Financial, Inc., a Registered Investment Adviser with the SEC. Gary Gordon, Pacific Park Financial, Inc, and/or its clients may hold positions in the ETFs, mutual funds, and/or any investment asset mentioned above. The commentary does not constitute individualized investment advice. The opinions offered herein are not personalized recommendations to buy, sell or hold securities. At times, issuers of exchange-traded products compensate Pacific Park Financial, Inc. or its subsidiaries for advertising at the ETF Expert web site. ETF Expert content is created independently of any advertising relationships.
