Index Futures Net Changes and Settlements:

Foreign Markets, Fair Value and Volume:
- In Asia 11 out of 11 markets closed lower: Shanghai Comp -4.02%, Hang Seng -3.10%, Nikkei -2.32%
- In Europe 12 out of 12 markets are trading lower: CAC -1.54%, DAX -1.71%, FTSE -0.88%
- Fair Value: S&P -1.87, NASDAQ +2.85, Dow -31.54
- Total Volume: 3.1mil ESH & 1.5k SPH traded in the pit
Today’s Economic Calendar:
Wholesale Trade 10:00 AM ET, and the Baker-Hughes Rig Count 1:00 PM ET.
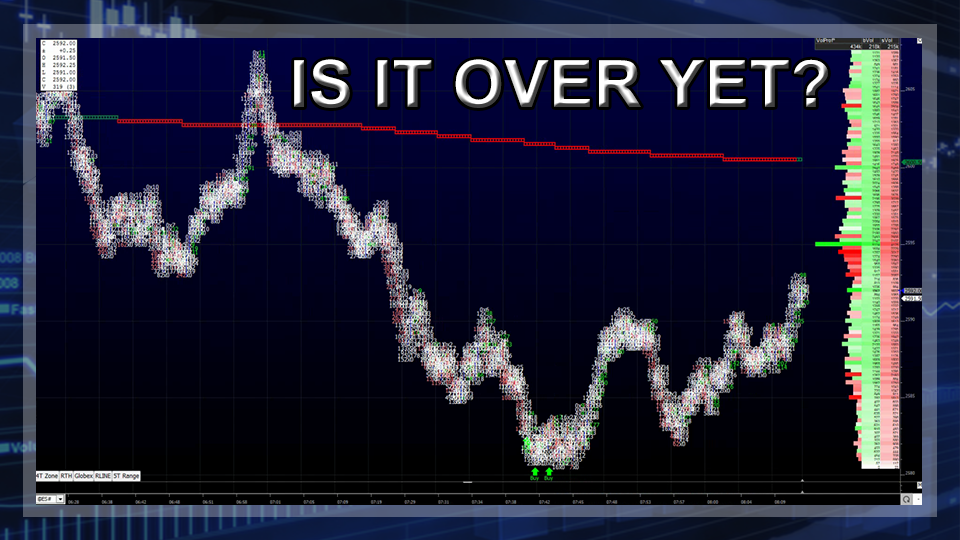
S&P 500 Futures: #ES Drops 150 Handles from Wednesdays 2727 High Down To 2577.00

After Wednesdays weak close the S&P 500 futures (ESH18:CME) sold off down to 2645.25 on Globex, down -23 handles, and then rallied up to 2687.50 just before the 8:30 CT futures open on Thursday morning. There were a lot of pops and drops along the way, but after seeing the overnight weakness, many didn’t expect the big rally before the open.
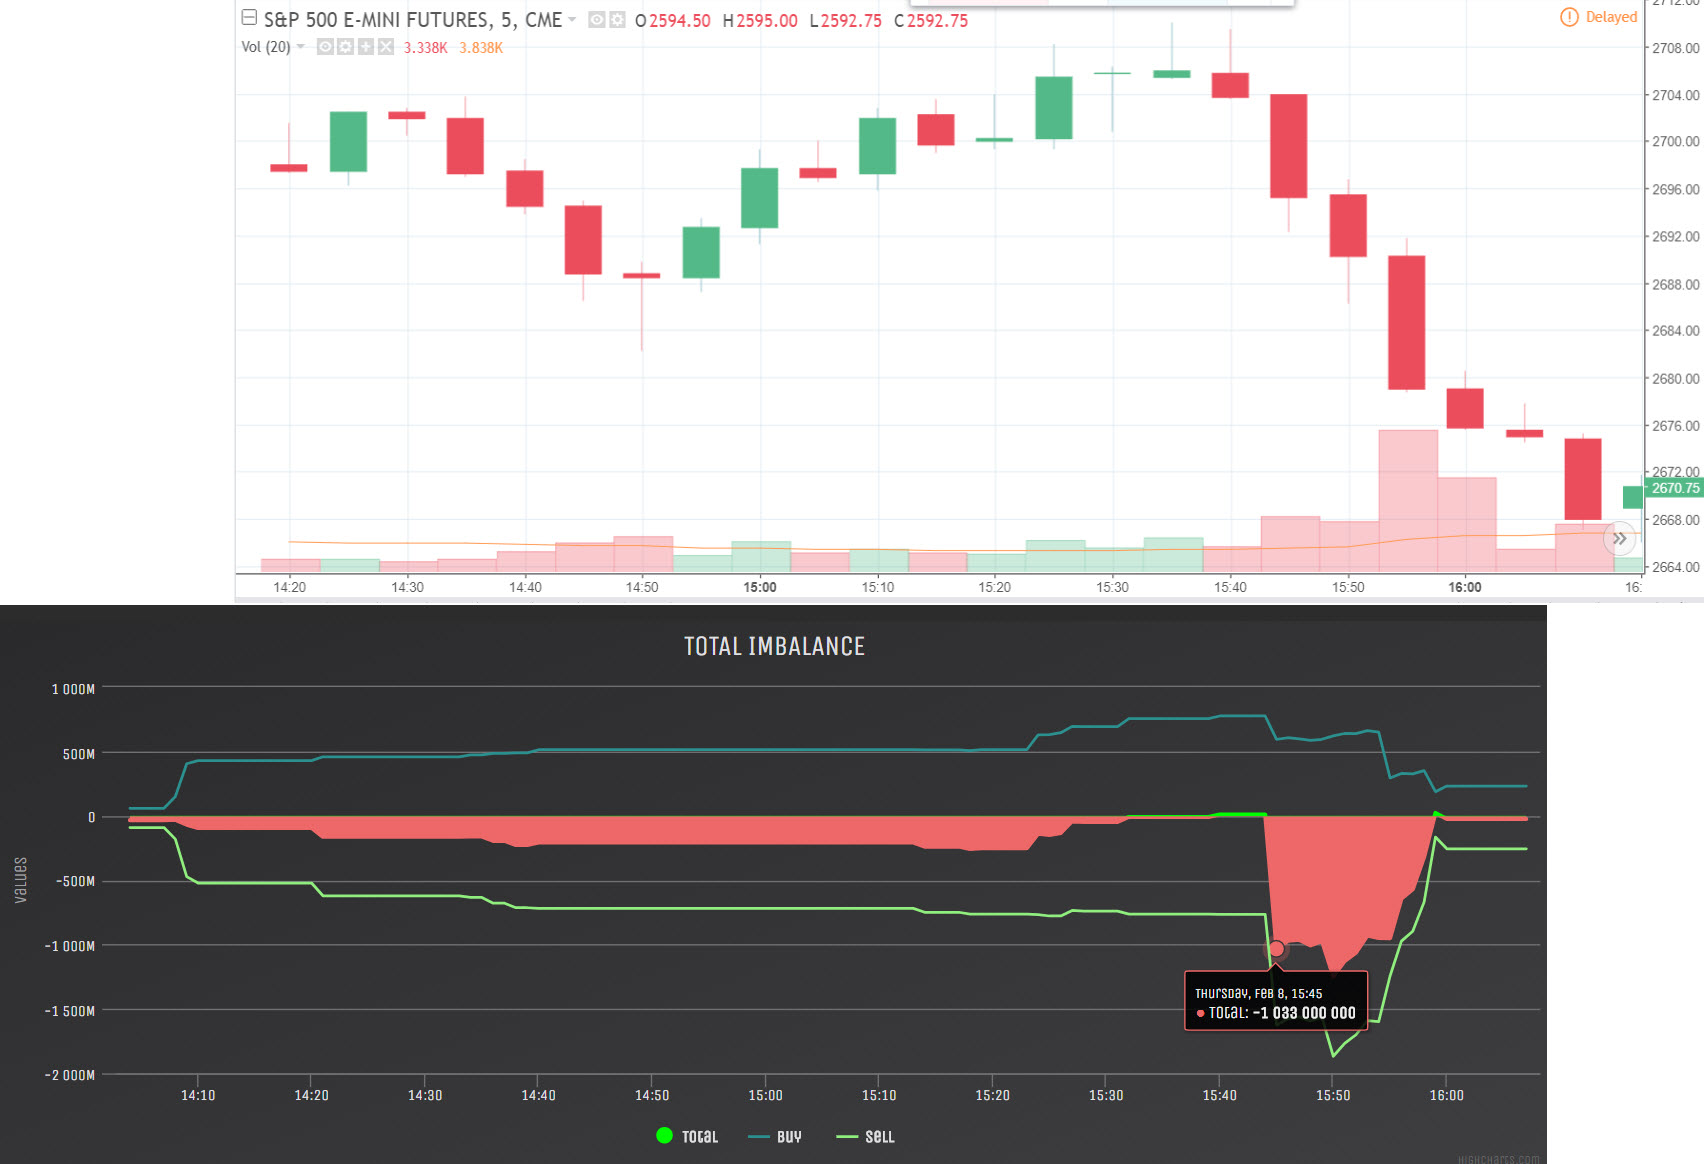
Total volume on Globex was 355,000 contracts, and the frist print came in at 2682.50. After the open its was waves of sell programs, and by 12:00 the ES had traded all the way down to a double bottom at 2627.25. From there it bounced a few handles, and then sold off down to 2613.25, down 51.50 handles on the day. After a bounce up to 2649.25, there was another selloff down to 2617.75, and then down to 2614.00. There was one last pop up to 2629.50, and then it got slaughtered all the way down to 2577.00, down 91.50 handles, on the 3:00 cash close. After the low the ES traded back up to the 2598 area, pulled back down to the 2586.75, and closed at 2590.00, down 78.50 handles, or down -2.94%.
In the end, the overall tone was extremely bearish. In terms of the overall trade, over 3 million ES traded. While the markets could go flying back up, we think it’s important to remember how MUCH the S&P has rallied from its credit crisis 666 low.
The (MiM) MrTopStep Imbalance Meter

Our MiM signaled a small imbalance going into the close, a hidden imbalance that didn’t materialize until the 3:45 pm ET reveal, where it hit the meter at -1B. From the S&P 500 futures chart above you can see how that accelerated the sell into close, where we hit another 9:1 down day. I am now on the lookout for a 9:1 up day, a day where buying volume outpaces selling volume 9:1. It is like a starter’s pistol for the next run up.
I love the camaraderie in the MrTopStep IMPRO and MiM rooms, and the willingness to share, some pretty good traders in there. Listen for the starter’s pistol.
Disclaimer: Trading Futures, Options on Futures, and retail off-exchange foreign currency transactions involves substantial risk of loss and is not suitable for all investors. You should carefully consider whether trading is suitable for you in light of your circumstances, knowledge, and financial resources. Any decision to purchase or sell as a result of the opinions expressed in the forum will be the full responsibility of the person(s) authorizing such transaction(s). BE ADVISED TO ALWAYS USE PROTECTIVE STOP LOSSES AND ALLOW FOR SLIPPAGE TO MANAGE YOUR TRADE(S) AS AN INVESTOR COULD LOSE ALL OR MORE THAN THEIR INITIAL INVESTMENT. PAST PERFORMANCE IS NOT INDICATIVE OF FUTURE RESULTS.
