Technical Developments to Watch:
- EUR/USD at fresh 2-year lows, next support comes in the 1.2470-1.2500 zone
- GBP/USD bias remains bearish below previous-support-turned-resistance at 1.6060
- USD/JPY rally may be stalling, all eyes on 1.10 (key psychological resistance)
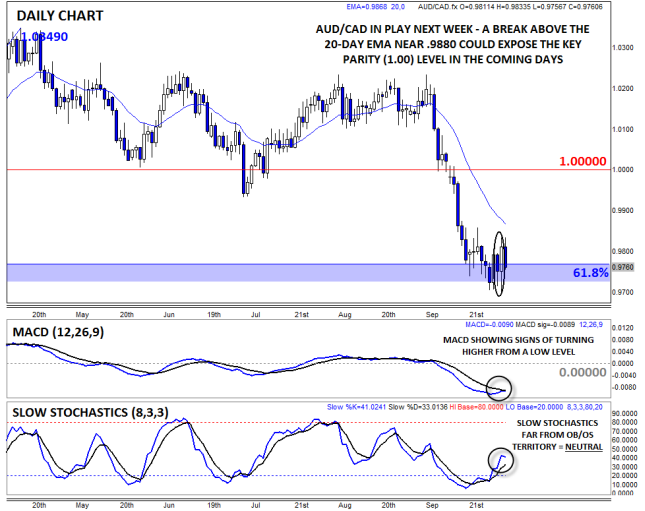
- AUD/CAD in play, stabilizing off longer-term Fib support in the mid-.9700s
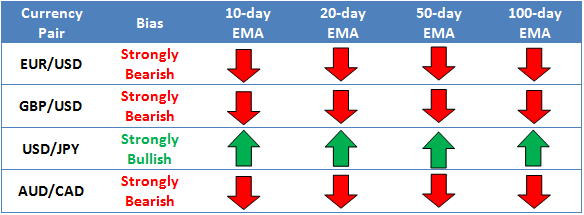
* Bias determined by the relationship between price and various EMAs. The following hierarchy determines bias (numbers represent how many EMAs the price closed the week above): 0 – Strongly Bearish, 1 – Slightly Bearish, 2 – Neutral, 3 – Slightly Bullish, 4 – Strongly Bullish.
** All data and comments in this report as of Friday’s European session close **

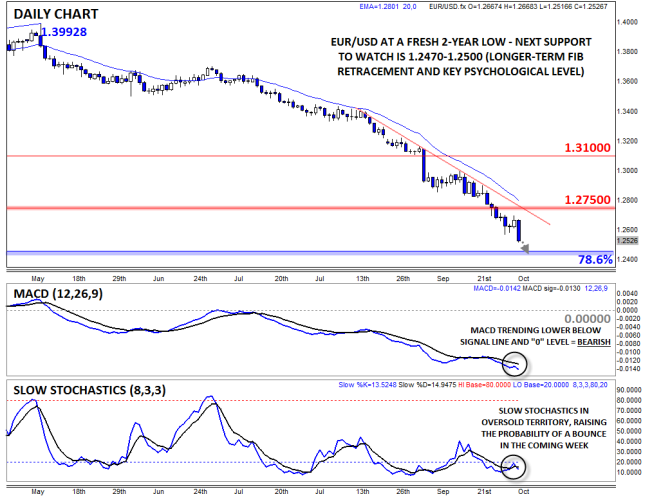
- EUR/USD extended its downtrend to hit a new 2-year low last week
- MACD still inching lower, Slow Stochastics still oversold
- Bias remains bearish below 20-day EMA at 1.2925
EURUSD extended its downtrend last week, with the pair reaching a new 2-year low in the lower 1.2500s as of the European close. A one-two punch of a dovish ECB meeting and strong NFP report drove the world’s most widely-traded currency pair to within striking distance of key psychological support at 1.2500. Not surprisingly, the MACD is showing strongly bearish momentum, while the Slow Stochastics remain in oversold territory. For this week, bears may look to draw a “line in the sand” at the long-term 78.6% Fibonacci retracement (1.2460), but if that floor fails, another leg lower is likely.

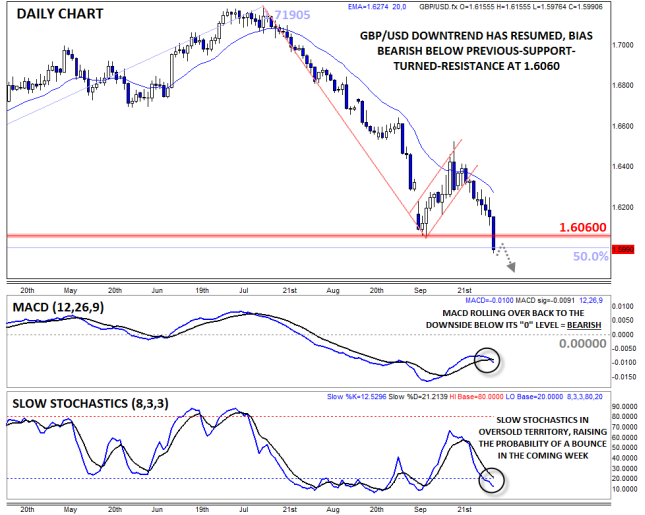
- GBP/USD grinded lower last week, accelerating through 1.60 support after NFP
- MACD turning lower again, though Slow Stochastics now oversold
- Bias remains bearish below previous-support-turned-resistance at 1.6060
GBPUSD inched gradually lower through the first four days of the week before dropping sharply in the wake of Friday’s strong NFP report. The pair dropped to a new 11-month low under 1.6060 and proceeded to break below the 1.6000 handle as we go to press. Much like the EURUSD, the MACD is turning lower below the “0” level, suggesting a shift back to bearish momentum, while the Slow Stochastics are back in oversold territory again. For this week, the bias remains bearish as long as rates remain below previous-support-turned-resistance at 1.6060.

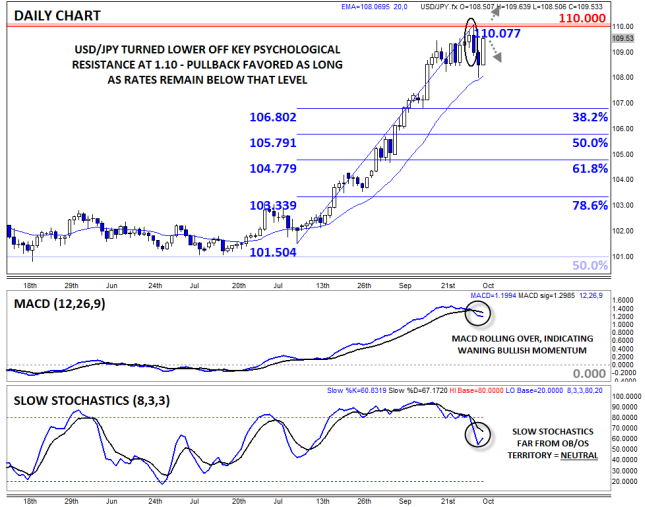
- USDJPY’s rally reversed sharply off 110.00 resistance
- MACD also turned lower, indicating waning bullish momentum
- Pullback favored as long as 110.00 resistance holds
The parabolic USDJPY rally reversed sharply after hitting psychological resistance at 110.00 midway through last week. The pair put in a large Bearish Engulfing Candle* off this resistance level, showing a big shift from buying to selling pressure and marking a potential medium-term top, though Friday’s strong NFP report from the US pushed the pair back up toward that level. Meanwhile, the MACD indicator also rolled over to cross below its signal line, shifting the momentum to the downside. For this week, a deeper pullback as long as 110.00 resistance holds, though if this barrier is broken, a quick run up to 110.60 would be likely.
*A Bearish Engulfing candle is formed when the candle breaks above the high of the previous time period before sellers step in and push rates down to close below the low of the previous time period. It indicates that the sellers have wrested control of the market from the buyers.

- AUDCAD stabilized off longer-term Fib support last week
- MACD turning higher, suggesting a possible shift back to bullish momentum
- Move above the 20-day EMA at .9880 could expose parity (1.00) next
AUDCAD is our currency pair in play due to a number of high-impact economic reports out of Australia and Canada this week (see “Data Highlights” below for more). Looking to the chart, rates stabilized off a longer-term 61.8% Fibonacci retracement level around 0.9750 last week. The pair then formed a large Bullish Engulfing Candle* off this zone, showing that the buyers may be taking the upper hand. The secondary indicators support this view, with both the MACD and Slow Stochastics turning higher from low levels. For this week, a break above the 20-day EMA around .9880 could open the door for a run toward the parity level (1.00) by Friday.
*A Bullish Engulfing candle is formed when the candle breaks below the low of the previous period before buyers step in and push rates up to close above the high of the previous candle. It indicates that the buyers have wrested control of the market from the sellers.
Central Bank Disparity and Rising Volatility
Last week we noticed something that we had not seen a very long time: diverging central bank policies within the G10. For some time the markets have been reacting to the potential for the Fed to shift from a dovish policy stance to one that is more neutral; however, the extent of changes elsewhere has caught our eye.
On the one hand, we have the Fed who is likely to embark on normalizing monetary policy at some stage in 2015. On the other hand, we have the ECB and the BOJ in Japan, where the market expects further easing measures. Somewhere in the middle we have the BOE (discussed in more depth below). We then have the Reserve Bank of New Zealand (RBNZ) intervening to weaken their currency in a size not seen since 2007, and we also have Norway’s Norges Bank buying their currency, although intervention was denied.
Thus, within the G10 we have five different paths for monetary policy. After six years of central banks all staying on hold (bar a period of madness from the ECB in 2011 and the RBNZ who hiked rates earlier this year to counteract rate cuts after the Christchurch earthquake), the path for global monetary policy has not been this divergent since before the financial crisis in 2008, which could boost volatility for the end of the year.
Let’s take the Bank of England. In the last three months, the market has priced in the prospect of a more-hawkish-than-expected central bank, after BOE Governor Mark Carney hinted that the market was behind the curve. This pushed the pound higher. However, political risk combined with a shift in focus at the BOE from the unemployment rate to weak levels of wage growth weighed heavily on the pound. After staging a mini recovery in the aftermath of the Scottish decision to vote No to independence, the pound reached a three-week low on Friday after some dovish comments from BOE members who said that they would not want to hike rates until inflation was stronger.
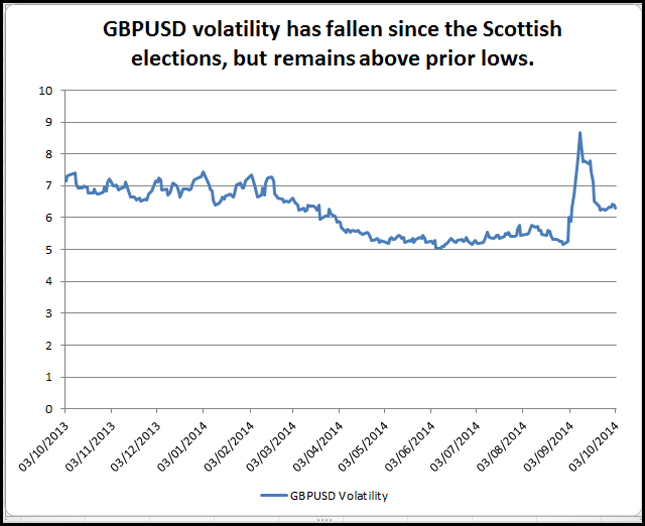
The result of this see-sawing in UK monetary policy expectations has been a rise in GBP volatility, as you can see in the chart below. After spiking ahead of the Scottish referendum, GBPUSD volatility has fallen, but it still remains above the previous lows, suggesting that monetary policy has taken over from politics as the biggest risk for the pound going forward.
Figure 1:
Source: FOREX.com and Bloomberg
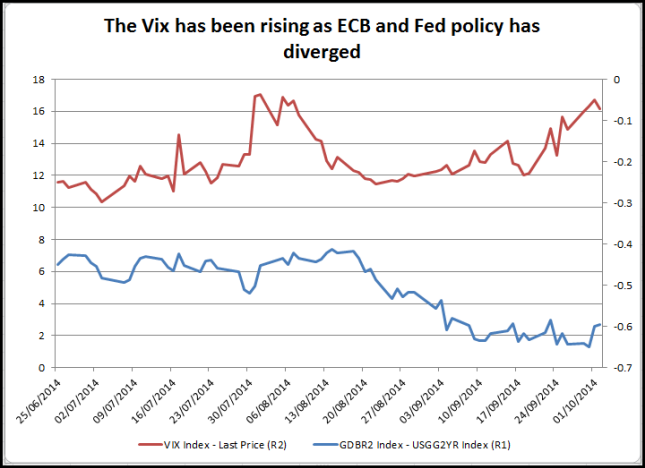
Figure 2 shows the spread between German and US two-year bond yields and the VIX index, known as Wall Street’s “fear gauge.” As the yield spread between Germany and the US has fallen to a seven-year low, the Vix has started to rise. This divergence is most apparent since September, which coincides with the market’s intense focus on global monetary policy.
Figure 2:
To conclude, if we see continued divergence in monetary policy expect continued volatility, with major implications for G10 FX in the coming months.
How Elections Can Impact Markets
Global political risk has picked up in recent weeks. First there was Scotland, now there are pro-democracy protests in Hong Kong and a presidential election in Brazil this weekend. Markets are sensitive to political risk, but it can be difficult to understand what sort of impact political risks can have on asset classes.
We decided to do some analysis on the impact of news stories relating to politics and the performance of domestic asset classes. Here is what we found:
Scotland
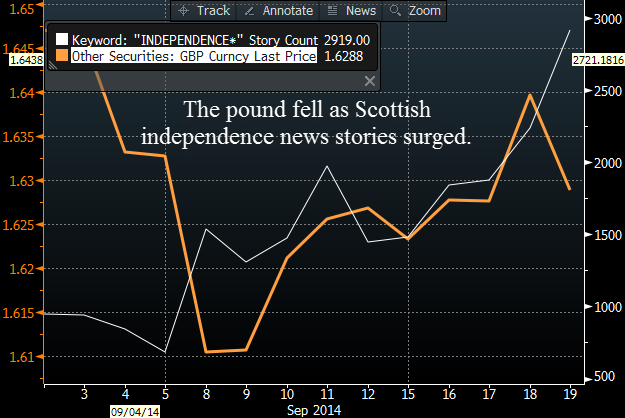
As you can see in the chart below, as the number of stories about Scottish independence ramped up the closer we got to Election Day we can see a potential negative correlation with the GBPUSD. This gives us an indication that the Scottish independence referendum may have dampened sentiment towards the pound.
Figure 3:
Source: Bloomberg – these prices do not reflect prices offered by FOREX.com
Hong Kong
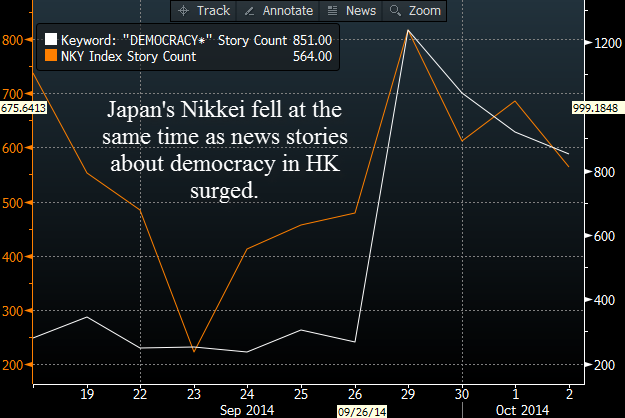
Although the protests are only in their early stages, there are signs that the Hang Seng is deeply impacted by events. This is not surprising, as political risk can weigh heavily on domestic asset prices. What is more interesting in our view is the fact that news stories about democracy in Hong Kong are having an impact on the Nikkei, suggesting that if the anti-China unrest in Hong Kong escalates over the coming months then it could cause contagion to other Asian countries, including Japan.
Figure 4:
Source: Bloomberg – these prices do not reflect prices offered by FOREX.com
Brazil
This weekend the citizens of Brazil will head to the polls. With only two days before the vote, incumbent Dilma Rousseff had extended her lead, and polls suggest that she would win re-election in a likely second-round runoff, with her main challengers tied for second place.
Tragedy stuck earlier this election cycle when Rousseff’s main opponent was killed in a plane crash. Socialist candidate Eduardo Campos died on August 13th; he was replaced by the popular Marina Silva. Before Campos’s death, Rousseff held a healthy lead; however, afterwards, Silva started to overtake the incumbent. At the same time as Silva took the lead, the IBOV index, Brazil’s main equity index, reached record highs. However, since the start of September Rousseff has staged a comeback in the polls, which has corresponded with a 14% drop in the Brazilian equity index.
The Brazilian real has also been under pressure since Rousseff has taken the lead in the polls, and USDBRL has rallied more than 12%. Although some of this selloff is down to concerns about Fed tightening and the impact that could have on countries like Brazil with large deficits, this analysis also suggests that domestic factors are at play, and the elections are making the declines in the IBOV and BRL worse.
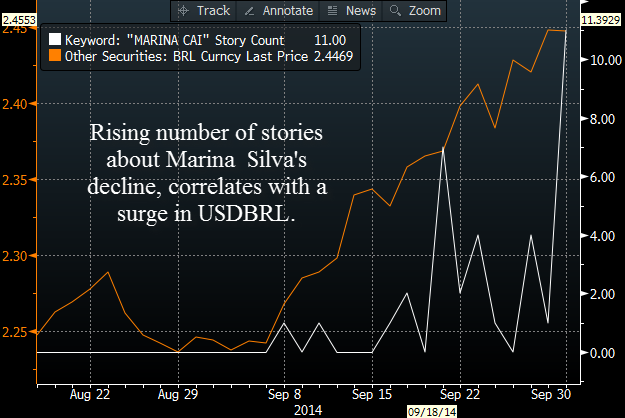
We have found a 60% positive correlation between news stories about Silva’s declining performance in the polls, and USDBRL. The relationship with the Ibovespa, the Brazilian equity index, is also significant, with negative news stories about Marina Silva’s election campaign weighing on the Ibovespa 55% of the time.
Thus, if Dilma Rousseff does win this weekend’s vote, then we could see another lurch lower for Brazilian assets (please note that FOREX.com does not offer the BRL or IBOV index).
Figure 5:
Source: Bloomberg, these asset classes are not offered by FOREX.com
Conclusion:
This analysis suggests that elections matter for markets, and they can trigger volatility. There are some major elections in 2015, including the UK general election in May; elections also take place in Spain, Finland, Turkey, Poland and Canada. Thus, political risk could be a major theme for 2015.
The global equity markets have come under severe selling pressure over the past couple of weeks. Risk has been off the menu for a variety of sentiment-sapping reasons, not least the ongoing geopolitical risks, continued fears about the health of the Eurozone and Chinese economies, and the withdrawal of the Fed’s QE stimulus program, among other things. These fundamental worries have been reflected on the charts which have likewise shown some bearish signs. Last week, for example, we looked at the Nikkei index which was looking vulnerable for a pullback as it tested the prior 2014 high. Sure enough, the Japanese index went on to drop by a good 1000 points from there, which weighed heavily on the USD/JPY currency pair too (a side note for our FX-only traders: it is important to be aware of the impact of the other markets on currencies e.g. commodities on CAD or AUD, stocks on AUD/JPY, etc. This is called intermarket analysis).
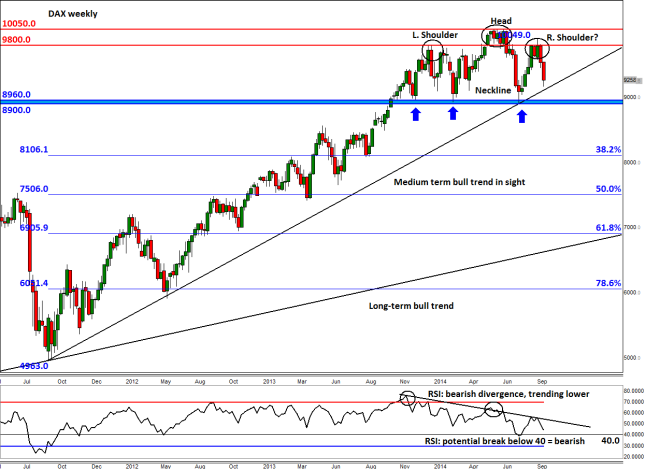
This week, we are looking at Europe and where better to start than Germany, for the benchmark DAX index in one of the most traded indices out there. This makes it a liquid and technically friendly asset, which is one of the most important aspects one has to consider when trading a particular market. Luckily, the index has so far been living up to expectations in this regard: it has fallen very sharply as soon as it became clear a potential reversal pattern was formed around 9800 a couple of weeks ago. As can be seen on the weekly chart below, there is a clear Head and Shoulders (H&S) pattern in the making. Although this pattern is not complete yet, it is worth pointing out that it is regarded as one of the most reliable reversal patterns out there. Still, the bears will need to be careful now that the markets have already endured a decent correction. Indeed, the long-term bullish trends are still intact on almost all of the major indices, including the bellwether S&P 500.
Nevertheless, the importance of the H&S pattern on the DAX should not be taken lightly. The ‘left shoulder’ was formed around 9800 at the start of the year when a few months of weak price action started before the index finally managed to find good support around 8900/60 area in March. That led to an eventual rally towards, and momentarily beyond, the psychological 10000 barrier in the summer. But as the index failed to hold there, which led to a break back below 9800, the ‘head’ of the H&S pattern was formed. The DAX went on to fall all the way back to that 8900/60 area where it once again found strong support in August. This 8900/60 is a pivotal area and thus marks the ‘neckline’ of the H&S pattern. Meanwhile the ‘right shoulder’ of the H&S pattern has potentially been formed around 9800 in recent weeks. We say ‘potentially’ because, as mentioned, this reversal pattern is still not complete. For all we know, the market could just as easily rally and break above 9800 and thus invalidate this bearish pattern.
For this H&S pattern to come to fruition, the DAX will first need to break a medium term bullish trend line that has been in place since September 2011. This comes in – depending on how fast it will drop, if indeed it does – somewhere around 9100. Once this is taken out then there is the actual neckline of the pattern; as mentioned, this is at 8900/8960. If the index were to break below that area then the long-term 38.2% Fibonacci level at just above 8100 could be the next major downside target. The bearish view is bolstered by the weekly RSI which has diverged negatively and has been trending lower. If the RSI breaks below 40, this would confirm we are in a downward trend.
In summary, the price action and some of the other longer-term secondary technical indicators look weak for the DAX which suggest we may see further falls in the stock markets over the coming weeks and months. But now that the markets have had a sizeable retracement already, there is also the possibility for a bounce back – especially as the long-term bullish trends are still intact. But regardless of what happens, there may well be plenty of trading opportunities for the bulls or bears to take advantage of next week.
Source: FOREX.com. Please note this product is not available to US clients.
Crude Oil prices dropped viciously once again this week. News of an unexpected drawdown in US oil stocks on Wednesday and the fact the dollar weakened prior to the release of the US jobs report on Friday were both largely ignored. Investors have also once again ignored the prospects of supply disruptions in the Middle East amid the US-led bombings of IS targets in the region. Likewise they appear little concerned about the fact oil production in Libya has fallen back slightly, admittedly following weeks of sharp increases. Crude’s battering therefore suggests the global oil market is excessively, or at best sufficiently, supplied. Indeed a survey released this week confirmed that not only the OPEC is producing more oil than is currently needed, but significantly that cartel is not doing anything about it. In fact, the largest OPEC oil producer, Saudi Arabia, has increased its output even though production has returned to near normal levels in Libya. But following such a steep drop it could be argued that the market may have overreacted and that prices could soon bounce back from these oversold levels – especially as the cold winter months are now looming large. Added to this, refineries will soon resume their operations following the usual seasonal maintenance work. Prices may find additional support if we see another drawdown in US oil stocks, preferably a sharp one at that. Still, for prices to stage a significant rally, the OPEC will need to address the excessive and rising supply situation.
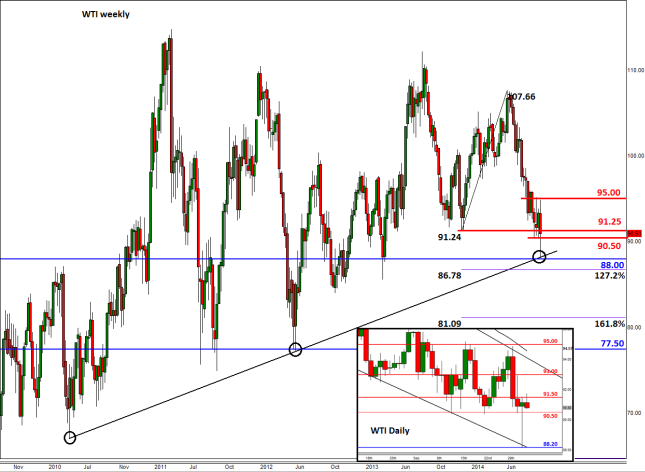
From a technical point of view, a recovery may already be underway for WTI. As can be seen, the US oil contract has bounced sharply off $88.00/20 – a level which corresponds with a long-term bullish trend line. Here, some of the sellers undoubtedly rushed to take profit on their positions and opportunistic longs took advantage of oversold prices. However, now that it has returned to the point of origin of the breakdown i.e. around the $91.50 area, the sellers could come back and drive prices lower once again towards the $88 level. Below $88, the next bearish target is the 127.2% Fibonacci extension level of the last major rally at $86.75/80. The 161.8% extension of the same move at $81.00/10 could be a longer term target. Meanwhile a continuation of the short-covering rally that began on Thursday could see WTI climb towards resistance at $93 and then $95.
Source: FOREX.com. Please note this product is not available to US clients.
Global Data Highlights
6th October: 0930 BST/ 0430 ET: Sentix investor confidence, October
Investor confidence has nosedived in the currency bloc since peaking in June, and the market expects another decline back to mid-2013 levels. If estimates are correct then we could see the pick-up in growth in the first half of 2014, completely eradicated. Although this survey is considered second-tier data, if we get another weak reading it is unlikely to stand in the way of further EUR weakness.
7TH October: Bank of Japan meeting concludes
The market expects no change from the BOJ this week, but it is worth watching out for Governor Kuroda’s speech. He usually talks at approximately 0730 BST/ 0230 ET. If he sounds like the BOJ is gearing up to add more stimulus, as some in the market expect, it could help USDJPY get over the 110.00 barrier towards 110.66 – the highest level since August 2008.
7TH October, 2014: 0930 BST/ 0430 ET: manufacturing and industrial production, August
It’s a quiet week for the UK, with production data one of the chief highlights. The market expects a fairly muted level of growth, with no change expected in industrial production and a 0.1% increase for manufacturing production. The annual rates of growth are expected to remain strong, at 2.6% and 3.4% respectively. The pound fell heavily at the end of last week, and GBPUSD touched the 1.60 level. Thus, after a heavy sell-off the pound could be due a break, and could be more sensitive to an upside surprise. If we get a number that beats expectations then we could see a mini pound recovery.
8TH October: 1900 BST/ 1400 ET: Fed minutes from September meeting
We don’t expect these minutes to tell us anything new about Fed policy as the September meeting included the latest “dot plot” / rate expectations from FOMC members, and a press conference from Janet Yellen. It will be interesting to see if any members disagreed with keeping “considerable time” in the Fed statement regards to keeping interest rates low. We expect the noted hawks on the Committee to have voiced objections to this. We will also look out for any discussion about inflation. Dudley, head of the NYC Fed, has said that he would like to see inflation run above 2% before he votes to hike rates. If there are a decent number of members who are concerned about falling price pressures then this could weigh on the buck.
9th October: 00050 BST/ 1950 (8th Oct) ET: Machine orders, August
There is a lot of second tier data being released from Japan this week, but machine orders stands out as the one to watch. The market expects orders to rise 0.7% for August, however the annual rate is expected to fall 4.9%. If the annual drop in orders is lower than that it could hit the Nikkei, which could weigh on USDJPY in the short term.
9th October, 2014: 1200 BST/ 0700 ET: Bank of England rate decision
We don’t expect any change to interest rates or asset purchases at this month’s meeting. Recent speeches by BOE members including Forbes and Broadbent both sounded slightly dovish, with both members mentioning that inflation is too weak to justify a rate hike. Thus, we don’t think that anyone will have joined Weale or McCafferty at this stage in voting for a rate hike. However, we won’t find out which way the members voted until the release of the minutes from this week’s meeting, which will be released on 22nd October. The minutes are more likely to have a bigger impact on the market than this week’s rate decision.
9th October: 1330 BST/ 0830 ET: Initial jobless claims
Initial jobless claims fell close to a 14-year low last week; we expect further improvement in the jobless claims after a stellar NFP reading for September. If we get a reading lower than 279k, the low from 18th July, this could give the dollar a boost as it would be another timely sign of labour market strength.
9th October: 1600 BST/ 1100 ET: ECB’s Draghi speaks ahead of the G20 meeting
G20 finance ministers and central bankers meet in Washington this weekend, and all eyes will be on Draghi’s press conference. At last week’s ECB meeting he did not announce anything new, and didn’t even attempt to formally talk down the EUR. Luckily for him, the strong payrolls report pushed the EUR down even further on Friday. We will be listening out to hear whether or not sovereign QE is waiting in the wings for the currency bloc, if he suggests that it is then we could see further downside for the single currency.
