Market Movers: Weekly Technical Outlook
Technical Developments to Watch:
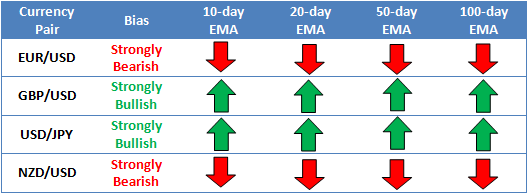
- EUR/USD testing support in the 1.0850-80 zone
- GBP/USD back above its 20-day EMA on rate hike expectations
- USD/JPY bias has turned back higher as safe haven demand fades
- NZD/USD in play, at a new 5-year low ahead of key RBNZ meeting
Source: FOREX.com
* Bias determined by the relationship between price and various EMAs. The following system determines bias (numbers represent how many EMAs the price closed the week above): 0 = Strongly Bearish, 1 = Slightly Bearish, 2 = Neutral, 3 = Slightly Bullish, 4 = Strongly Bullish.
** All data and comments in this report as of Friday afternoon **
EUR/USD

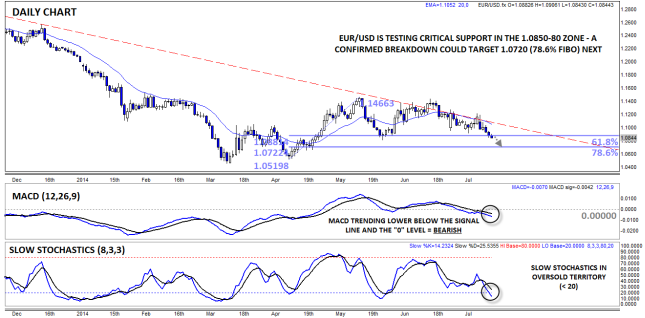
- EUR/USD sold off despite fading risks of a Grexit last week
- MACD continues to show bearish momentum
- All eyes on critical support in the 1.0850-80 zone
After briefly trading up to fill its bearish gap, EUR/USD sold off consistently through last week, ignoring the progress on the Greek debt bailout. As we’ve noted before, the market is using the euro as a funding currency in the carry trade, meaning that traders tend to sell the single currency when global financial risk decreases (even if that risks originates in the Eurozone itself). On a technical basis, the pair is testing key support in the 1.0850-80 zone, with a break below that level potentially exposing 1.0720 (the 78.6% Fibonacci retracement) next. The MACD continues to show growing bearish momentum, though the oversold Slow Stochastics hint at a possible bounce early this week.
Source: FOREX.com
GBP/USD

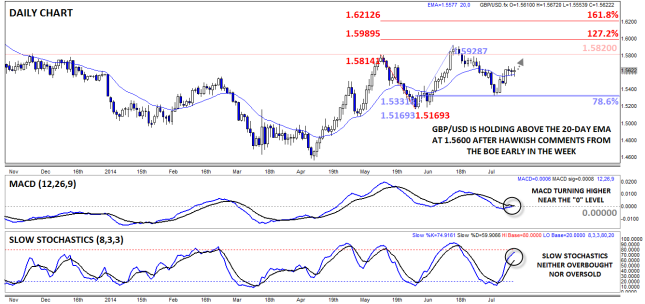
- GBP/USD rallied on hawkish rhetoric from the BOE early in the week
- MACD and Slow Stochastics indicate balanced, two-way trade
- Short-term bias is cautiously bullish above the 20-day EMA at 1.5570
GBP/USD rallied sharply on Tuesday, propelled by surprisingly hawkish rhetoric from the Bank of England, with BOE Governor Carney noting that “The point at which interest rates may begin to rise is moving closer given the performance of the economy” and that “wages are beginning to grow, interest rates are at historically low levels, and so households should begin to manage their finances with the assumption that there should be an upward adjustment in interest rates.” Needless to say, traders were caught off guard by these comments, and GBP/USD has now recovered back above its 20-day EMA near 1.5570. With both the MACD and Slow Stochastics in neutral territory, the bias on the pair is cautiously bullish as long as rates can hold above the 20-day EMA near 1.5570.
Source: FOREX.com
USD/JPY

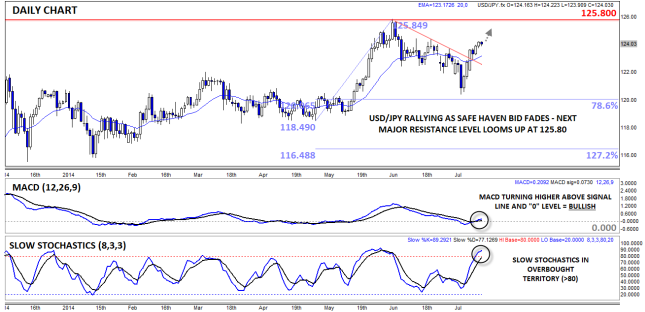
- USD/JPY surged last week as safe haven demand faded
- MACD turning back higher, but Slow Stochastics are now overbought
- The move back above the 20-day EMA near 123.00 suggests we could see more upside
USD/JPY rallied consistently throughout last week as safe haven demand for the Japanese yen faded in the wake of the progress on Greek’s bailout negotiations. From a technical perspective, the pair broke above its near-term bearish trend line and the 20-day EMA around 123.00, potentially opening the door for further gains this week. The MACD supports this view, trending higher above its signal line and “0” level, though the overbought Slow Stochastics point to a possible pause or pullback early this week. Nonetheless, the bias in the pair will remain higher as long as support around 123.00 holds.
Source: FOREX.com
NZD/USD

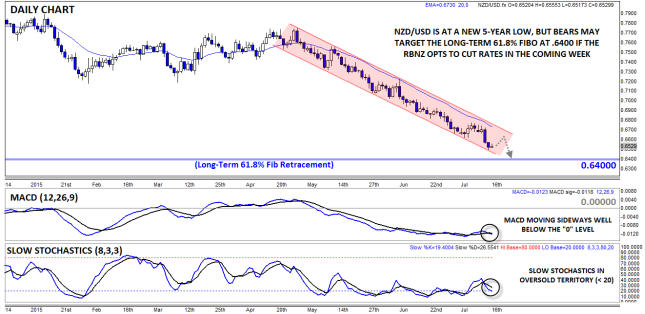
- NZD/USD broke to a new five year low near .6500 last week
- MACD neutral, but Slow Stochastics peeking into oversold territory
- The bias remains clearly lower, though conservative traders may prefer to fade a bounce
NZD/USD is our currency pair in play this week due to a number of high-impact economic reports out of both the US and New Zealand in the coming week (see “Data Highlights” below for more). Last week, NZD/USD dropped to a new five-year low near .6500 amidst falling milk prices and fears that the RBNZ could cut interest rates this week. As it stands, the MACD is in-line with its signal line but well below the “0” level, and the Slow Stochastics are peeking into oversold territory. For this week, bears could look to target the long-term 61.8% Fibonacci retracement at .6400, especially if the RBNZ opts to cut rates.
Source: FOREX.com
Who will hike first – the US or the UK?
A theme is upon us that could determine the direction of financial markets for some time to come. Yield differentials came back into focus last week as the key driver of the FX market, hence why the pound and the dollar were the best performing currencies in the G10 last week
In contrast to the ECB, who remains committed to loose monetary policy, the Federal Reserve and the Bank of England both touted the prospect of a rate rise last week. This has driven short-term yields in the UK and the US, which in turn boosted the pound and the dollar.
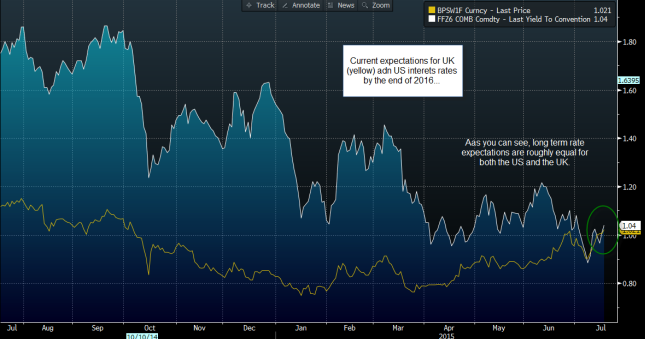
To answer who will hike first, we will assess market expectations. The Fed Funds Futures, one measure of when the market thinks the Fed will hike rates, expects rates to rise by 25 basis points by the end of the year, with only a small minority expecting rates to rise in September. This is possibly a touch dovish in comparison to Fed Governor Yellen, who sounded fairly upbeat on the prospect of a rate rise this year. US core CPI rose to 1.8% in June and the economy continues to create jobs, thus there is an argument to be made that the Fed could raise rates in September.
In contrast, yields on Sonia GBP swaps are pricing in one hike over the next six months, which suggests that rates could rise by January next year. We believe that the Fed will pip the BOE to the post when it comes to the timing of the first rate hike, with a strong chance that the Fed could hike rates as early as September, as US inflation seems to be recovering more quickly than in the UK. This may give the USD the edge vs. the GBP in the coming weeks, as the market may potentially price in the
But what about the pace of rate hikes? This is also important for the markets, as if, as central banks suggest, rates will only rise in a gradual manner, then the rate differential between the US and UK and the rest of the G10 may be short-lived, which could have implications for the FX market.
What this means for FX:
Currently the Fed Funds Dec 2016 contract is expecting US rates to end next year at just over 1%, the Sonia 18-month contract puts UK rates at roughly the same level by the end of next year. Unless this changes dramatically then we could see GBP/USD trade in a tight range in the coming months, with both central banks roughly equal on the rates front.
Overall, if it looks likely that the Fed will hike rates in September then this is likely to keep the dollar as the king of the G10 FX space in the coming weeks. We continue to think that both the EUR and JPY remain vulnerable in the coming months, as do the commodity currencies, who may continue to struggle from weak commodity prices and a stronger dollar.
Source: FOREX.com, Data: Bloomberg
Q2 earnings season gets off to a flying start
The markets had been expecting Q2 earnings season to be negative, with earnings and sales growth both dipping. However, that is not the way things are going so far. There have been some notable earnings beats with Google (NASDAQ:GOOGL), Bank of America (NYSE:BAC), and Citigroup (NYSE:C) all posting better than expected results for the three months to June.
Thank the consumer for the positive results so far:
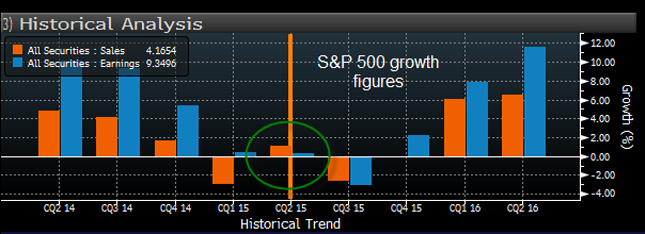
Although it’s early days and only 10% of all companies on the S&P 500 have reported earnings, the results look promising as both earnings and sales figures have surprised on the upside. Notable outperformers include the consumer goods, and financials sectors on the positive surprise front. On the growth front, basic materials, financials and technology have seen positive sales and earnings growth so far.
This has helped to drag S&P 500 sales growth back into positive territory, after it was negative in Q1, and earnings growth is also on track for a quarterly rise this year. This doesn’t mean that there are no weak links in this earnings season, the industrial and oil and gas sectors have been very weak so far. However, we will give them the benefit of the doubt at this stage since only 5% of oil and gas companies have reported earnings, so there is time for the earnings data to improve. Added to this, the bar for growth in both of these sectors is so low that some companies are bound to beat these forecasts.
Watch the technology sector:
The technology sector could be one to watch this earnings season after Google reported a 17% rise in profits in Q2. The detail of its earnings report was also strong, with an 11% rise in advertising revenue, and a strong pick up in volume.
Google reported earnings per share of $6.99, the market had expected EPS of $6.72, this was the first time that Google had beaten estimates for several quarters and the good news was duly reflected in the share price, Google’s pre-open quote on Friday suggested that Google’s share price could open approx. 11% at the open.
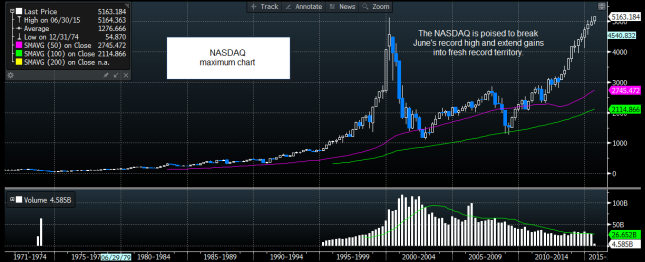
A rise of this magnitude could be enough to boost the NASDAQ technology index into record high territory. This sector has already had a fantastic run in the last 12 months and is up some 25% since October 2014. A sharp rise in Google’s share price on Friday could boost this index even further.
But can the tech sector sustain these lofty heights?
This may depend on how the other large tech companies fare during earnings season. Yahoo (NASDAQ:YHOO), Apple (NASDAQ:AAPL), and Microsoft (NASDAQ:MSFT) all release earnings next week, while Twitter (NYSE:TWTR) and Facebook (NASDAQ:FB) both release earnings the week after. Watch out for Apple’s results. It has managed to consistently beat earnings forecasts in recent quarters; one quarter it has to slip up, surely? If it does so during this quarter then it may be the trigger for investors to take profit on their long NASDAQ positions.
Conclusion:
Overall, if we continue to see Q2 earnings season beat expectations then US markets may be able to extend recent gains and withstand the prospect of a rate hike from the Federal Reserve later this year. Currently the earnings season looks supportive of further gains in the US index.
However, the NASDAQ could be vulnerable to profit-taking now that it is close to a record high, and specifically if tech giant Apple finally misses earnings expectations when it reports next week.
Source: FOREX.com, Data: Bloomberg
Source: FOREX.com, Data: Bloomberg
Look Ahead: Stocks
S&P 500
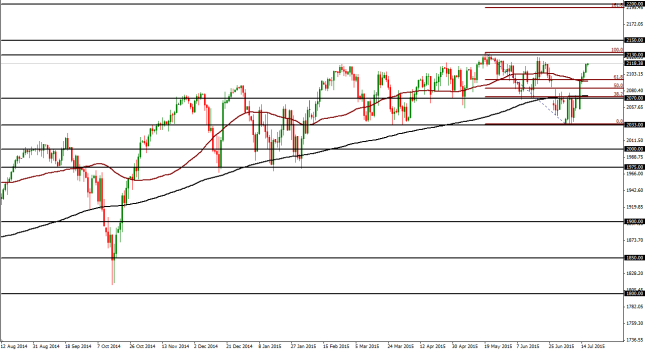
Within the context of the long-term bullish trend going back more than six years, the S&P 500 index has rebounded from key support around the 2035 level in the past two weeks to begin re-approaching its all-time high of 2134 that was hit this past May. This rebound follows a volatile pullback in the latter part of June and early July that was triggered in part by the Greek debt crisis and sharp plunges in China’s equity markets. This severe volatility prompted a plunge from near the noted all-time high to break down below both the 50-day and 200-day moving averages and then drop further to establish a three-month low by early July.
After market perceptions of risk regarding the Greek financial/political situation and China’s stock meltdown began to subside, the S&P 500 found its base around the noted 2035 support level, which was last tested as support in March and April. From there, the resulting rebound has pushed the index back above its 200-day and 50-day moving averages once again. With company earnings season well underway in the US, the clear upside target on continued bullish momentum is at the noted 2134 record high.
From a longer-term technical perspective, any further move above that high, in uncharted territory, could begin to target further upside around the 2200 level, which is around the 161.8% Fibonacci extension of the most recent pullback. Downside support on any subsequent pullback resides around the key 2070 level, followed by the noted 2035-area base.
Source: FOREX.com. Please note this product is not available to US clients
DAX
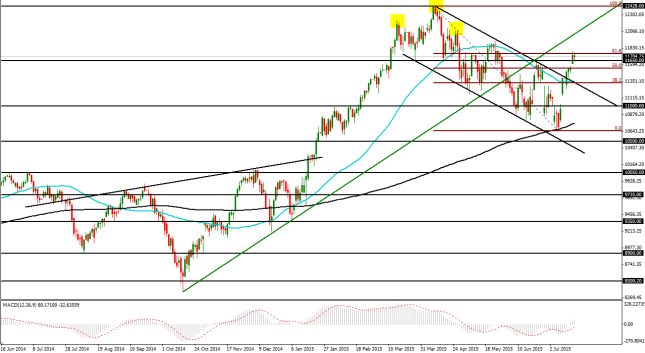
The German DAX index broke out in mid-July above a large descending trend channel that extended back to April’s all-time high around 12390. From that peak down to July’s low point around 10650, the DAX saw a downside correction of approximately 14% in under three months. That low point established nearly a five-month low, and was also right at the key 200-day moving average.
As optimism grew over a potential Greek bailout deal, and China’s financial regulatory measures began to show some results, the DAX made a sharp rebound from the 200-day average, gapping up towards the 50-day moving average and the top of the descending trend channel. The moving average and trend channel provided little in the way of resistance as the index continued its run to break above the 11650 resistance level. If the DAX continues its run above this 11650 level, the path is relatively clear of resistance until the 12000 psychological level. Any further strengthening on a longer-term basis could then reach for a re-test of the noted 12390 high. Downside support on a pullback currently resides around the 11200 level.
Source: FOREX.com. Please note this product is not available to US clients
Look Ahead: Commodities
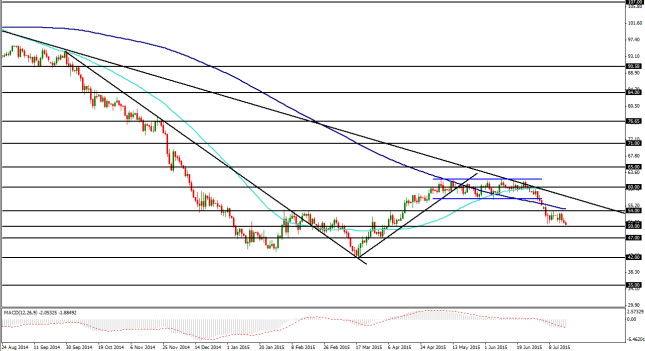
Crude oil has been a primary focus this year, with both benchmarks, Brent and West Texas Intermediate (WTI), falling precipitously from last year’s highs. In the case of WTI, US crude oil plunged from a high above 107.00 in June of 2014 down to a six-year low around 42.00 by March of this year. That plunge represented a 60% decline in less than nine months.
After that low was established, prices rebounded until May, when WTI entered into a prolonged trading range with fluctuations above and below the 60.00 level. This consolidation lasted until late June, when oil began a sharp slide that pushed it close to the 50.00 psychological support level. This slide prompted a breakdown below both the 200-day moving average as well as the key 54.00 support level. WTI then formed a rough bearish, or inverted, flag pattern that may well serve as a downside continuation pattern if broken down. If WTI continues to trade below 54.00 resistance, clear downside support targets on a break below the noted 50.00 psychological level are at 47.00 followed by a potential re-test of the 42.00-area multi-year low.
Source: FOREX.com. Please note this product is not available to US clients
Global Data Highlights
UK:
22/07: 0830 GMT: BOE minutes
The market will be looking to see if BOE’s Carney’s recent hawkish talk is representative of the rest of the MPC. We expect all members to have voted in unison against changing policy at the July meeting. We will be watching to see if MPC members are happy with the outlook for inflation and growth in the coming months. If the pound is to rally on the back of these minutes, then we may need to see signs that BOE members could vote for a rate hike in the coming months.
23/07: 0830 GMT: UK retail sales, June
The market is expecting another pick up in retail sales for June. If the market is correct at predicting a sales rise (including fuel) of 4.8%, then this would be roughly in line with the average for 2015 of 4.9% so far. Since the strength of the pound and recent concerns about the Eurozone have thrown into doubt the potential for UK exports, domestic demand is likely to remain a key contributor to UK growth in the coming months. A stronger June reading than expected could boost the prospects for Q2 GDP, which is released the following week. We expect GBP to be sensitive to retail sales, and either a big positive surprise could boost the pound, while a weaker than expected figure could cause a short-term dip in sterling.
Europe:
24/ 07: 0800 GMT, July
The market is expecting Europe’s PMI survey data to remain roughly in line for the currency bloc, which would suggest that the economic recovery is continuing at the same pace. The composite is expected to dip back slightly to 53.9, from 54.2, if this month’s data beats expectations then we could see a jump in the EUR after last week’s losses.
US:
23/07: 1230 GMT, Chicago Fed, July
We don’t usually pay too much attention to the individual state survey data, but this month is different after a big miss for the Philly Fed last week. The market expects this index to recover back to -0.05 from -0.17, if we get another data miss then the market may start to raise concerns about the strength of the US economy at the start of Q3, which could weigh on the dollar.
24/07: 1345 GNMT, Markit US Manufacturing PMI, July
Although this index is not as popular as the ISM surveys, it could get extra attention after a spate of weaker national data. The market expects a slight increase in the index for this month, picking up to 53.8 from 53.6. Watch out for new orders and inflationary components, since a surge in prices paid could make a US rate hike in September more likely, and thus boost the dollar.
Japan:
22/07, 2350 GMT, Japan Trade Balance, June
The market is expecting a recovery in the trade balance for June to Y 45.8bn from -Y 217.2bn, which is expected to result from a boost to exports and a drop in imports. Overall, Japan’s trade balance has been improving in recent months. Considering we have a bearish outlook for the yen for the rest of this year, this could further boost Japan’s trade balance in the months to come.
New Zealand:
22/07: 2100 GMT: RBNZ interest rate decision
The market expects a cut to rates from 3.25% to 3%. This has been well signaled to the market and is one factor driving the Kiwi lower, it has been the weakest performer vs. the USD in the last 6 weeks, with NZD/USD dropping some 8%. We think there could be room for further cuts this year, and if the RBNZ sounds dovish (as we expect) and hints at further cuts, we think NZD/USD and NZD/GBP could come under another attack.
