Highlights
- Market Movers: Weekly Technical Outlook
- GBP/USD: Burgers, the BOE, and Generational Support Levels
- Look Ahead: Stocks
- Look Ahead: Commodities
- Global Data Highlights
Market Movers: Weekly Technical Outlook
Technical Developments:
- USD/JPY rallied off a potential double-bottom pattern this past week, but could see further declines on any return of stock market volatility. Technical bias: Neutral to Moderately Bearish
- GBP/USD has continued to drop on Brexit concerns and could be prepared to resume its sharp bearish trend. Technical bias: Bearish
- EUR/USD has fallen to the bottom of a key parallel trend channel and may be poised for a breakdown on positive US economic data and possible ECB easing actions. Technical bias: Bearish
- USD/CAD broke down below a key support level on a tentative rise in crude oil prices, and could possibly have further to fall in the short term on continuing hopes for a deal to freeze oil output levels. Technical bias: Neutral to Moderately Bearish
USD/JPY
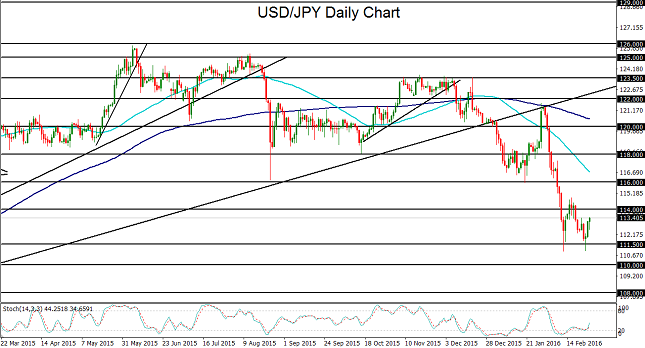
USD/JPY spent the earlier part of this past week dropping down to hit key support around 111.00, forming a potential double-bottoming pattern in conjunction with an earlier February low. During the latter part of the week, however, the currency pair rebounded as crude oil and global equity markets staged a comeback. Prior to this relative stabilization, global stock market volatility had become the norm since the beginning of the year, prompting precipitous declines for the equity-correlated USD/JPY, especially since the beginning of February when the US dollar depreciated substantially.
Those declines culminated in an early February low slightly below 111.00, before a relief rebound occurred that tracked steadying equity markets. This past week, as noted, the currency pair once again plunged to hit a low around the 111.00 level as crude oil uncertainty resumed its grip on global stock markets. This re-test of 111.00 created a potential double-bottom chart pattern that may have presaged at least a temporary bottoming of USD/JPY. Possibly supporting this view is the ever-present potential for a currency intervention by the Bank of Japan, with the aim of curbing unwanted appreciation of the yen. With regard to this, two unknowns persistently remain: 1) Around what level would the Bank of Japan intervene? And 2) Would intervention really have any lasting impact on keeping the Japanese currency down in the face of continuing market volatility that boosts the safe haven yen? These questions remain to be answered, but what is currently known is that financial markets have sustained a generally fearful environment despite this past week’s rebound, and the recent trend for USD/JPY has been unmistakably to the downside.
Therefore, barring any major stock market recovery or drastic Bank of Japan intervention, USD/JPY remains pressured over the short term. If this continues to be the case, the current double-bottom pattern could simply be a moment of respite within a continuing slide. Provided the currency pair sustains trading below the 114.00 resistance level, any breakdown below the noted 111.00-area lows would confirm a continuation of the downtrend. In that event, the next major targets to the downside reside at the 110.00 and then 108.00 support objectives.
GBP/USD
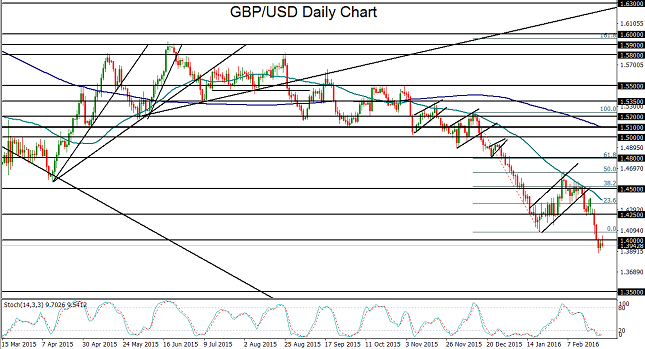
Early on during the past week, the British pound took center stage as it extended its plunge due to increasing fears over the ramifications of a potential UK exit from the European Union, or “Brexit.” Sterling fell against the dollar, euro, yen, and others, to further extend its losses after British multinational bank, HSBC, issued a stern warning that a Brexit would damage UK economic growth substantially and potentially result in another 20% drop in the pound’s value against the dollar. Though the vote is not scheduled until early summer, speculation over the potentially severe consequences of an actual UK exit of the EU has increasingly weighed on the pound, especially since the June 23rd referendum date to vote on EU membership was confirmed this past week. The extension of GBP/USD’s recent plunge resulted in a breakdown below major support around the psychologically significant 1.4000 level, establishing nearly a seven-year low under 1.3900 in the process.
This confirms a continuation of the longstanding bearish trend for the currency pair. Although GBP/USD is technically oversold after such sharp and prolonged declines recently, and some semblance of a relief rebound may be forthcoming, both the overall fundamental outlook as well as the longer-term price momentum are currently pointing to the downside. Of course, this could change if near-future developments start to indicate a lower likelihood of a Brexit. With GBP/USD having fallen sharply since mid-February, and especially with this past week’s noted breakdown below previous support at 1.4000, the currency pair is currently eyeing a key downside support objective at the 1.3500 level. That support level represents the major long-term low established in the beginning of 2009.
Source: FOREX.com
EUR/USD
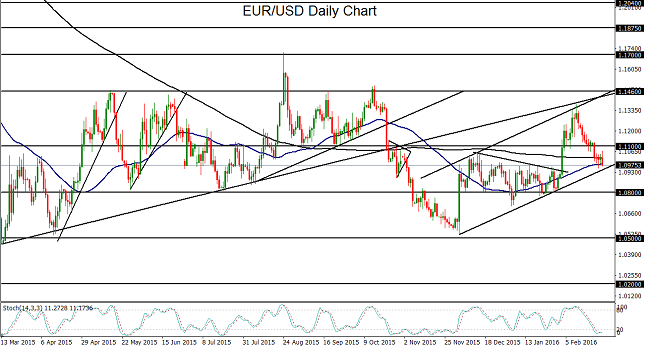
EUR/USD spent this past week in a continued decline after having dropped sharply since mid-February. By mid-week, the currency pair hit a new three-week low under 1.1000. During the course of this precipitous drop, EUR/USD broke down below previous major support at the 1.1100 level and has fallen back down to a convergence of its 50-day and 200-day moving averages. As of this writing, it has also dropped down to approach a key uptrend support line within a parallel trend channel extending back to early December’s low near 1.0500. The euro has been pressured recently due to several different factors, including the increasing possibility that the European Central Bank (ECB) will soon act to implement additional monetary easing measures. ECB President Mario Draghi recently made comments indicating a strong willingness and readiness to do so.
Scheduled early next month is the eagerly awaited ECB Press Conference, which should provide clearer guidance as to what those easing measures may entail. Also pressuring the euro has been the increased threat of deterioration in the European Union, most notably by an upcoming referendum in the UK to vote on whether or not it stays in the EU. A UK exit, or “Brexit,” could not only cause potential damage to the UK and sterling, but also to the remaining members of the EU and the euro. On the US dollar side of the EUR/USD currency pair, extreme doubts earlier in the month with regard to another Federal Reserve rate hike have been mitigated by relatively positive domestic economic data as of late, including Friday’s positive surprise in fourth-quarter US GDP growth. Scheduled for late next week are the US Non-Farm Employment Change, Average Hourly Earnings, and Unemployment Rate data for the month of February.
As the US employment situation is one of the primary economic indicators taken into consideration by the Fed in setting monetary policy, these data points are typically crucial in reinforcing or changing interest rate expectations as well as the short-term fate of the dollar. With significant negative factors weighing on the euro, and the still-conceivable potential for further Fed tightening providing some support for the dollar, EUR/USD could continue its recent downward trajectory to align with its long-term bearish trend. From a technical perspective, as long as EUR/USD continues to trade below the noted 1.1100 level, which has now become resistance, the stage could be set for a breakdown below the current parallel uptrend channel. In the event of such a breakdown, the next major target is at the 1.0800 support level, followed further to the downside by the key 1.0500 support objective.
Source: FOREX.com
USD/CAD
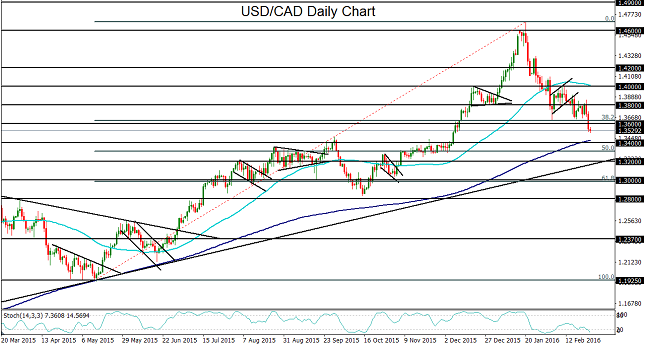
USD/CAD spent this past week mostly in decline as crude oil markets were lifted by more substantive talk regarding a proposed OPEC/non-OPEC crude production cap at January’s output levels. Crude oil was also boosted by an International Energy Agency (IEA) report that projected US shale oil production to decrease substantially within the next two years. Specifically, the IEA expects to see shale production in the US decrease by 600,000 barrels per day in 2016 and by 200,000 additional barrels per day in 2017. Despite the Saudi oil minister asserting this past week that major oil-producing countries would not actually be seeking to cut output, crude oil was able to rally during the latter half of the week as speculators saw these recent developments as a potential start to alleviating the persistent oil oversupply situation. With this crude rally, the Canadian dollar was also pushed higher due to its close correlation with oil prices. This pressured the USD/CAD currency pair to break down below key support around the 1.3600 level towards the latter part of the week. This breakdown also prompted a drop below the 38% Fibonacci retracement of the bullish trend that runs from the 1.1900-area lows in May of last year all the way up to the 12-year high above 1.4600 in January. While a further recovery in crude oil prices is far from assured, a continued short-term bounce on hopes for a coordinated deal to cap output is certainly possible. In this event, with any sustained trading for USD/CAD below the noted 1.3600 level, the next major downside support target resides around the key 1.3400 level.
Source: FOREX.com
GBP/USD: Brexit, Burgers and Big Generational Support Levels
Unless you’ve been living under a rock, you know that GBP/USD has been in freefall over the last several weeks amidst fears of a potential “Brexit” (UK exit from the European Union) come June. But in the current short-attention-span/24-hour news cycle/twitter zeitgeist, it’s easy to lose sight of the truly long-term picture.
Not only has GBP/USD dropped down to test its lows from the Great Financial Crisis, but on a LONG-term perspective, the pair is actually testing a 30-year generational support level. As the below chart shows, very few traders on global trading desks have ever seen GBP/USD trade below the 1.37 handle, including even when George Soros “broke the Bank of England” back in the early 90s, the peak of the US tech boom in 2000, and the depths of the Great Financial Crisis back in 2009.
Frankly, in contrast to those dire times for cable, the outside chance of a Brexit and relatively easy monetary policy from the Bank of England seem like very manageable issues for bulls. Of course, readers should also consider the other half of the currency pair, namely the fact that the US dollar is the only developed market that is actively normalizing monetary policy, providing a long-term tailwind for buck bulls.
Over these extremely long-term time horizons, long-term mean reversion factors like Purchasing Power Parity (PPP), or the theory that an identical good in two different countries should cost the same amount regardless of the currency used, play a big role. As a tongue-in-cheek estimate of PPP, The Economist created the “Big Mac Index” in 1986, based on the relative cost of a Big Mac in 48 different currencies. The current Big Mac Index for PPP shows that the GBP/USD is undervalued by about 15% vs. the greenback, its lowest relative valuation this century. Over long periods of time, we would expect this indicator to revert back toward 0% (in other words, the Big Mac Index suggests that GBP/USD may rise).
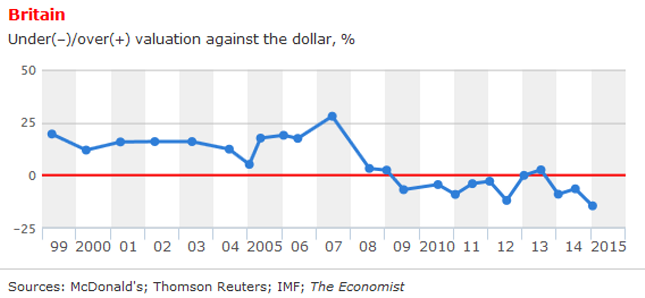
Technical View
As we noted above, there is strong previous support near the current level of GBP/USD. Specifically, the 1.37-1.40 zone has put a floor under GBP/USD on four separate occasions in the past 30 years, leading to long-term rallies between 3,500 and 7,500 pips (no typo). Of course, that’s no guarantee of a bottom forming this time around, but it does suggest that a lot of long-term traders will be keyed in on this zone. Beyond the significant support zone in price, the monthly RSI indicator is testing oversold territory (
Over the next few weeks and months, GBP/USD will likely continue to gyrate on risk sentiment, economic data, and the latest Brexit opinion polls. But by taking a step back and putting the day-to-day moves into a long-term perspective, there’s a compelling case to be made that GBP/USD is undervalued, especially if/when the UK populace votes for the status quo to remain in the EU.
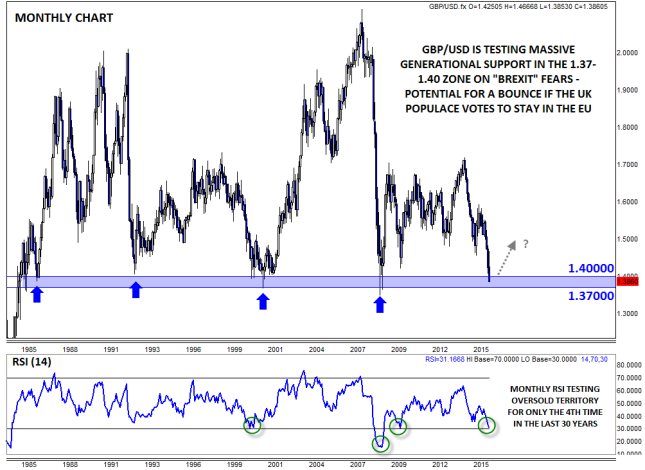
Source: FOREX.com
Look Ahead: Stocks
Sentiment in the stock markets has improved significantly this week, mainly because of the rallying prices of oil (see the detail below) and improvement in US data, which has also dampened the demand for safe haven assets like gold and yen. Next week’s economic calendar is full of top tier data and if they show further improvement then equities could extend their gains along with the dollar. But if the dollar appreciates significantly then it could hurt US exports and corporate earnings. The potentially stronger data meanwhile will also boost expectations about further 2016 rate rises. So the relationship between economic data and stocks is not as straight forward as it is for the dollar. But that is a worry for another day. In the short-term, positive data would most likely be cheered by the stock markets. As will further gains for oil, which may happen if Brent crude holds above the $36 handle on a daily closing basis. But failure for oil to extend its gains would most likely be a bearish outcome for stocks and risk assets across the board.
In our daily reports, we have highlighted several short-term technical bullish indications for stocks throughout the week, details of which can be found on the website. In particular, we have been watching the S&P 500 closely and specifically the area around 1945-1950, where a number of technical indicators converged, including the top of the recent range and the 50-day moving average. Although this level was defended at the first time of asking on Monday, the resulting sell-off was not strong. Sensing the weakness in bearish momentum and conviction, the buyers stepped in bullishly around the key long-term support and resistance level of 1900 in mid-week. As a result, the S&P rallied and has now broken above the 1945-1950 range.
This 1945-1950 area will now need to be defended by the bulls and as long as we hold above it, the short-term trend would be bullish. While this is the case, there is a possibility the S&P may aim for the next potential resistance zone around 2000-2010. This is where previous support meets the 61.8% Fibonacci retracement level.
But we can’t stress enough that the long-term technical outlook is still bearish, so be wary of false breakouts. If the chart only contained the 50- and 200-day moving averages, you will have noticed very clearly that they are both pointing lower and sit in the wrong order. For that reason, any potential rallies should be seen as a counter-trend move, for now. So when it comes to trading, the bulls should continue to remain nimble. Indeed, if the S&P moves back below the 1950-1945 support area then the short-term outlook would turn bearish once more. In this potential scenario, the next stop for the S&P may well be at 1900 or even the long-term support area around 1820-30.
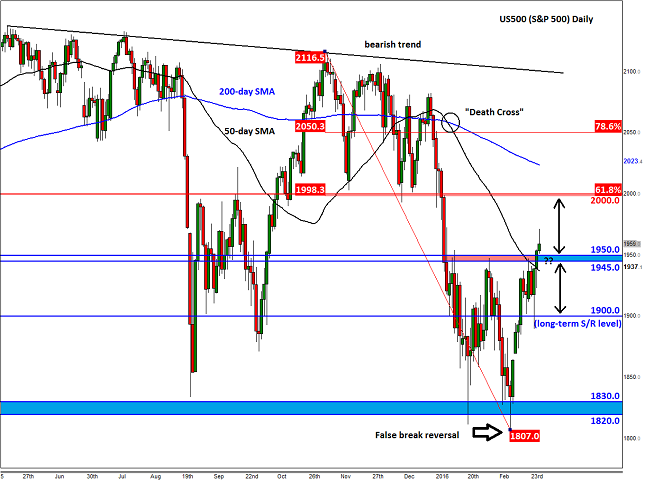
Source: FOREX.com. Please note this product is not available to US clients.
Look Ahead: Commodities
Crude oil prices have stormed back this week. At the time of this writing on Friday, Brent was trading at a good $36 per barrel while WTI was above $33.50. Both contracts have been supported first and foremost by a general improvement in risk sentiment, with equities also bouncing back buoyantly in recent days. More specific to oil, signs of a noticeable crude output decline in the US and on-going talks about an oil production freeze between some OPEC and non-OPEC countries are both helping to provide support, at least for the time being. Saudi Arabia and a few other OPEC members have reached a tentative agreement with Russia to cap their future production at the January levels. Although Iraq and Iran appear unwilling to participate in this agreement, the deal, if agreed, with or without Iraq and Iran, would still be a positive first step of coordination between large oil producing nations. According to oil ministers of Russia and Venezuela, it will be signed by mid-March.
In the US, oil production has already started to fall. But the continued declines in the rig counts, combined with significant reduction in capital expenditure and reports that some oil companies are apparently filing for insolvency, all point to a more significant output reduction there. Providing that demand growth remains healthy, all this points to a more balanced oil market later in the year. But in the short term, oil investors are worried about the high inventory levels which show no signs of easing. In fact, the US Energy Information Administration (EIA) on Wednesday reported another 3.5 million barrel increase in oil supplies for the week ended February 19. Bizarrely, this actually provided support to prices because the official build was significantly lower than the unofficial 7.1 million barrel build that had been reported by the American Petroleum Institute (API) the day before. But for WTI to make a serious comeback there needs to be a sustained period of sharp destocking. If seen, this would be another sign that would suggest the supply glut is slowly being reduced.
Meanwhile the price behavior of the oil continues to point to sideways trading inside large ranges. But one thing for certain is that bearish speculators are fast running out of reasons to express their views aggressively at these still-depressed levels. For one, most of the bad news is now surely priced in – although this does not necessarily mean we won’t see further sharp price declines as the fundamental situation could easily change for worse again. For another, it could be that the oil market participants have overreacted to all this excess supply stories. The markets do tend to overplay in both directions because behind every trade is a human – or more commonly now, a robot set up by a human – who is not always rational. So who knows, oil could reverse course and head back towards the equilibrium price – whatever level that may be, assuming it is higher.
The charts of oil have certainly been displaying bullish characteristics of late but so far neither contract has broken above their respective key resistance levels in order to confirm a change in the trend. But that could change now, for Brent was testing a key resistance and the top of its recent range at $36.00 at the time of this writing. A decisive break above here may pave the way for top of the bear channel around $39 and then the psychological level of $40 next. But if Brent breaks outside the bear channel, this would strongly suggest we have already seen a bottom for oil. Needless to say, a failed break at $36.00 would be bearish. In this case, Brent could fall back to its 50-day moving average around $33.60 initially. The chart of WTI is likewise looking bullish but it too remains beneath its recent range high and an established bearish trend. But could it break higher now? The momentum indicator RSI has already been trending higher for both contracts after making a series of bullish divergences. So, all oil needs now is a push which could then trigger fresh momentum buying. Speculators may wish to wait for oil prices to make a move then trade in the direction of the break.
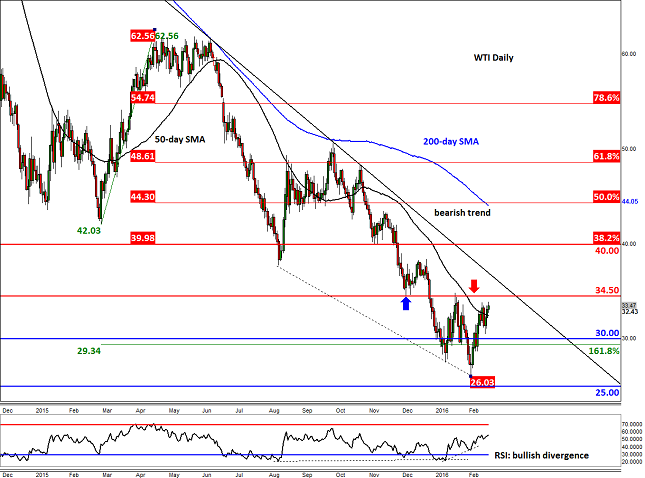
Source: FOREX.com. Please note this product is not available to US clients
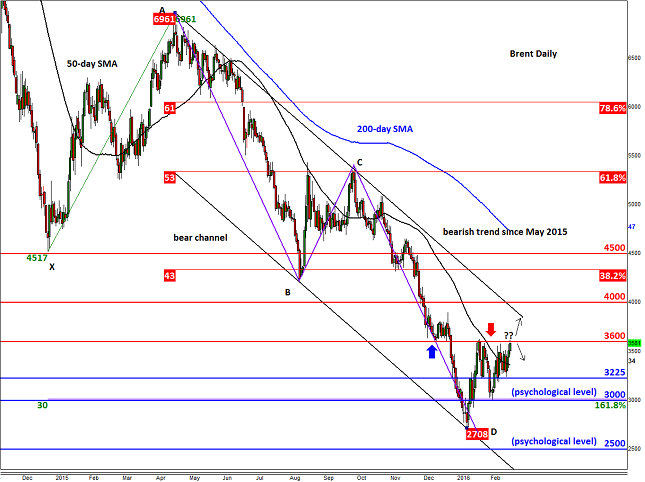
Source: FOREX.com. Please note this product is not available to US clients
Global Data Highlights
Monday, February 29
No top-tier data releases scheduled.
Tuesday, March 1
1:00 & 1:45 GMT – Official and Caixin Chinese Manufacturing PMI
China was the initial epicenter for 2016’s global market volatility to date, so traders will closely watch to see whether manufacturing activity is bouncing back from contraction territory. For what it’s worth, some analysts view the Caixin report as more reliable than the official government data, though keep in mind that Caixin is a Chinese media company. Regardless, China bulls will be hoping that both measures pop back into positive territory (>50).
3:30 GMT – RBA Interest Rate Decision and Statement
The Australian economy has been surprisingly resilient, despite the slowdown in China and falling commodity prices of late, and for that reason, the RBA is widely expected to leave interest rates unchanged at 2.0% again this month. That said, traders are looking for a dovish bias to the statement, and any comments that imply a rate cut is just around the corner could still hurt the Aussie.
13:30 GMT – Canadian GDP (December)
Canada releases monthly readings of its GDP report, so they tend to be particularly noisy, and because they’re 60-90 days old by the time they’re released, the figures tend to have less of an impact on the loonie than other countries’ GDP readings. Nonetheless, a stronger-than-anticipated reading could help the Canadian dollar build on its recent gains.
15:00 GMT – US ISM Manufacturing PMI
Manufacturing figures out of the US have been rather lackluster of late, due to a slowdown in key overseas markets (Europe and Asia) as well as the deleterious effect of the strong dollar. The last three Manufacturing PMI figures have all missed expectations and printed in the 48-49 zone, and based on market expectations, another reading in that area is likely this week.
Wednesday, March 2
13:15 GMT – US ADP Employment Change
Last month’s decent 205k reading in ADP jobs failed to lead to correspondingly strong reading in the more widely-watched Non-Farm Payrolls report, and expectations for this month’s ADP report have predictably been revised lower. Traders and economists anticipate a 185k reading in ADP this time around, which if seen, would be the lowest since August.
Thursday, March 3
9:30 GMT - UK Services PMI
Much like in its former colony across the Atlantic, UK service sector activity has dramatically outperformed the manufacturing sector of late. That trend is expected to carry over into this week’s data, with traders and economists expecting a reading of 55.1 after 55.6 last month.
15:00 GMT – US ISM Non-Manufacturing PMI
While the “Service sector outperforming manufacturing” theme appears set to continue in the UK, there are signs that the US service sector slowed down sharply in January. For that reason, the market is only looking for a 49.8 reading, below the boom/bust line at 50, in this month’s Non-Manufacturing report. If seen, that would mark the first contraction in service sector activity since 2009.
Friday, March 4
13:30 GMT – US Non-Farm Payrolls
The big kahuna of US jobs reports will come out early in Friday’s US session. As of writing, traders and economists expect headline job growth to bounce back to 195k after last month’s “disappointing” 151k reading. Just as important as the headline job creation figures, the report will also include details on last month’s change in wages (average hourly earnings) – if we can see another solid growth figure there, it could signal price pressures coming down the pipeline and could shift the Fed into a more hawkish posture, with potential benefits for the US dollar.
Disclaimer: The information and opinions in this report are for general information use only and are not intended as an offer or solicitation with respect to the purchase or sale of any currency or CFD contract. All opinions and information contained in this report are subject to change without notice. This report has been prepared without regard to the specific investment objectives, financial situation and needs of any particular recipient. Any references to historical price movements or levels is informational based on our analysis and we do not represent or warranty that any such movements or levels are likely to reoccur in the future. While the information contained herein was obtained from sources believed to be reliable, author does not guarantee its accuracy or completeness, nor does author assume any liability for any direct, indirect or consequential loss that may result from the reliance by any person upon any such information or opinions.
Futures, Options on Futures, Foreign Exchange and other leveraged products involves significant risk of loss and is not suitable for all investors. Increasing leverage increases risk. Spot Gold and Silver contracts are not subject to regulation under the U.S. Commodity Exchange Act. Contracts for Difference (CFDs) are not available for US residents. Before deciding to trade forex and commodity futures, you should carefully consider your financial objectives, level of experience and risk appetite. Any opinions, news, research, analyses, prices or other information contained herein is intended as general information about the subject matter covered and is provided with the understanding that FOREX.com is not rendering investment, legal, or tax advice. You should consult with appropriate counsel or other advisors on all investment, legal, or tax matters. FOREX.com is regulated by the Commodity Futures Trading Commission (CFTC) in the US, by the Financial Services Authority (FSA) in the UK, the Australian Securities and Investment Commission (ASIC) in Australia, the Financial Services Agency (FSA) in Japan, the Investment Industry Regulatory Organization of Canada (IIROC) in Canada and the Securities and Futures Commission of Hong Kong (SFC) in Hong Kong.
