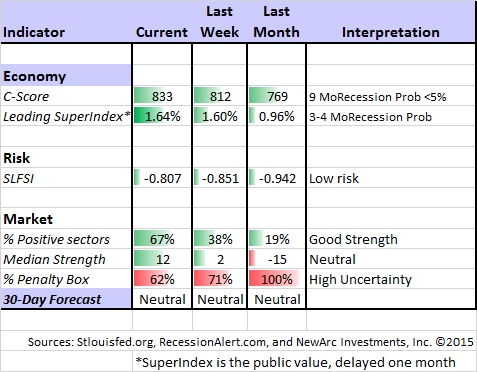
There is plenty of economic data this week and earnings season is in full swing. Despite this, I suspect that news from Europe will dominate the market discussion.
I expect market participants to be watching closely for The Message from Europe.
Prior Theme Recap
In last week’s WTWA I predicted that there would be a focus on the message from corporate earnings reports. That was very accurate for the week as a whole. The big exception was the ECB celebration and commentary on Thursday. There was plenty of speculation about what the corporate news was telling us about energy price effects, the impact of dollar strength on earnings, and especially the outlook. I expect that to continue this week as well.
Feel free to join in my exercise in thinking about the upcoming theme. We would all like to know the direction of the market in advance. Good luck with that! Second best is planning what to look for and how to react. That is the purpose of considering possible themes for the week ahead.
This Week’s Theme
This is an especially difficult week for my regular approach of guessing the theme. I could be completely wrong by the time you read this post on Sunday or Monday. Sometimes you plan, but also remain flexible.
- The Greek snap election has important implications for the Eurozone, a possible “Grexit,” changing bailout rules, and policies involving other Eurozone members. Sara Sjolin at MarketWatch has a good account of the issues, the contending parties, and how to interpret the news.
- The ECB plan for QE is still actively debated. Most are trying to use the US program as a template to interpret the needed size and potential for success. Dr. Ed is rather skeptical.
- The FOMC announces policy at mid-week. Will anyone care?
- Earnings season is still in the early stages. Since this provides an independent source of economic data, it will command respect.
These competing themes have a common thread – the influence of Europe on the world economy, corporate earnings, and worldwide central bank policy.
I expect this week’s theme to be A Focus on Europe.
As always, I have some additional ideas in today’s conclusion. But first, let us do our regular update of the last week’s news and data. Readers, especially those new to this series, will benefit from reading the background information.
Last Week’s Data
Each week I break down events into good and bad. Often there is “ugly” and on rare occasion something really good. My working definition of “good” has two components:
- The news is market-friendly. Our personal policy preferences are not relevant for this test. And especially – no politics.
- It is better than expectations.
The Good
In a slow news week there were a few bright spots.
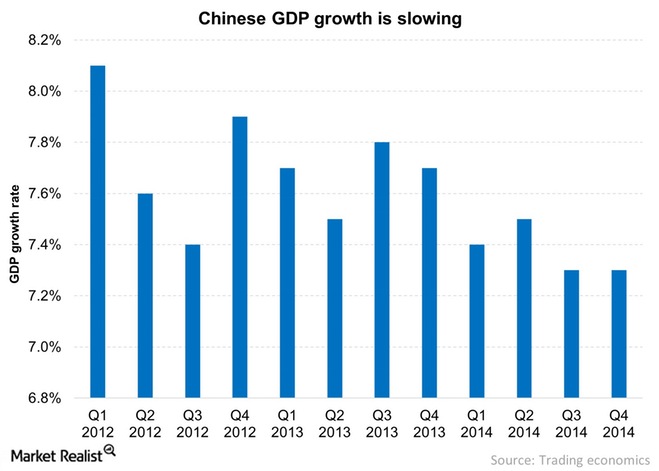
- China GDP increased 7.4%, beating expectations by 0.1% China has been attempting to alter the nature of its economy with less reliance on exports. We all know that the data may be suspect. The chart below shows the quarterly results for your consideration. The major media sources unanimously put a bearish spin on this report, noting that it was the lowest growth in twenty years. While this is technically accurate, the Chinese economy defies the “hard lending” predictions that are so popular and the real story was the leveling off of the decline. The WSJ article is typical.
- Earnings news has been positive. 79% of the 90 S&P 500 reporting companies have beaten estimates. 54% have beaten on revenues, which is a bit below the long term average. To my surprise, the market has rewarded the beats more than punishing the losers. So far in this reporting season, my “final thought” warning from last week has been incorrect. (FactSet)
- Gasoline savings are showing up in spending. This CNBC article has the credit card data as well some charts to illustrate. Restaurants and e-commerce (counter-intuitive?) were the biggest winners.
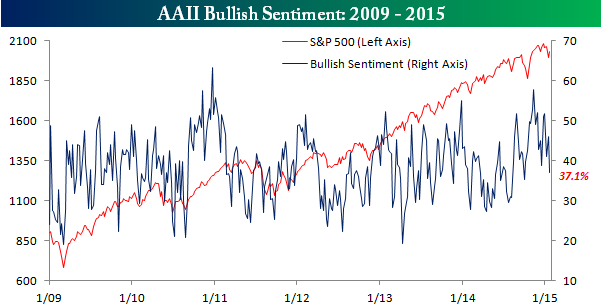
- Bullish sentiment declined. Bespoke has the report on the AAII survey. This is one of the charts:
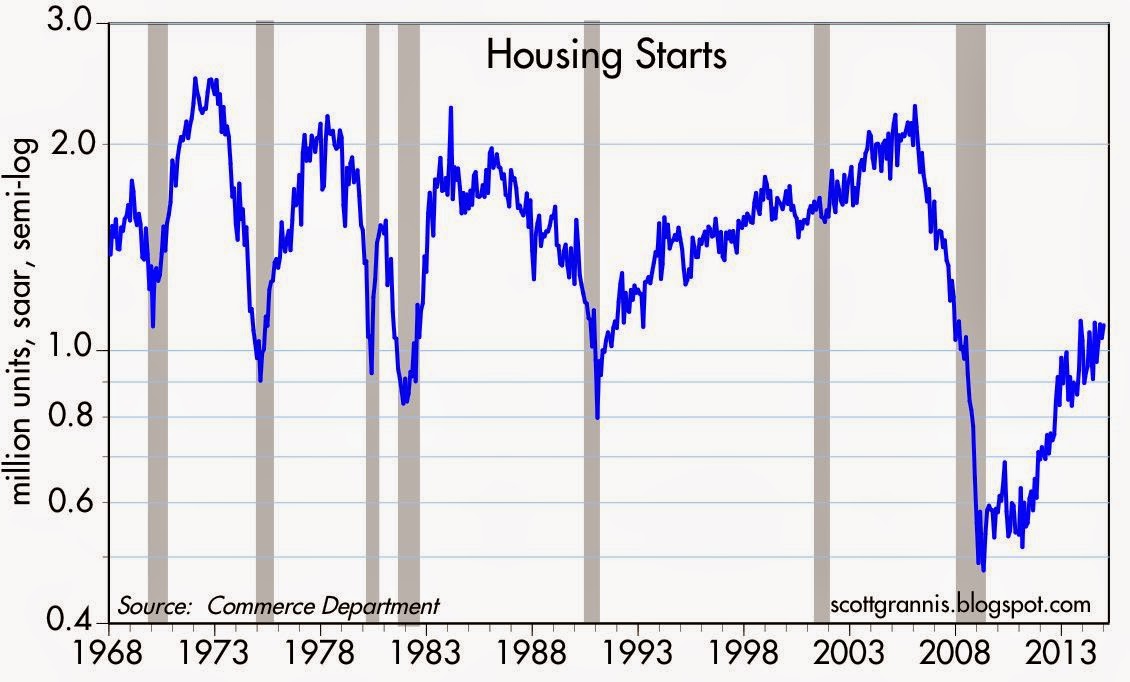
- Housing starts rose 4.4%, much better than expected. Scott Grannis notes that the small beat still leaves the growth at discouraging levels.
- European QE beat market expectations. This was the story at the end of the day, and I report the market interpretation of the news. When the announcement came, an hour before the market opened, stock futures spiked higher, mostly because the perception was that it was a larger program than expected. It did not take long for that rally to evaporate, and futures decline more than 1% from the high. The problem was that the target numbers were not clear increases since they included existing programs. Later in the day there was some conventional wisdom using the US QE analogy – the old simplistic formula that injecting liquidity had to be good for European stocks. Somehow that translated to a positive for US stocks. On Friday, the conclusion was not so clear. Calculated Risk has a good summary of the immediate reactions. The policy change was widely anticipated, and less important than the Thursday trading suggested. By the end of the day, every journalist was explaining the market move in ECB terms. I wonder how they would have done if required to file stories at the market opening, based on the policy facts, not the market reaction. Put another way, how would traders have done with a copy of the statement in advance.
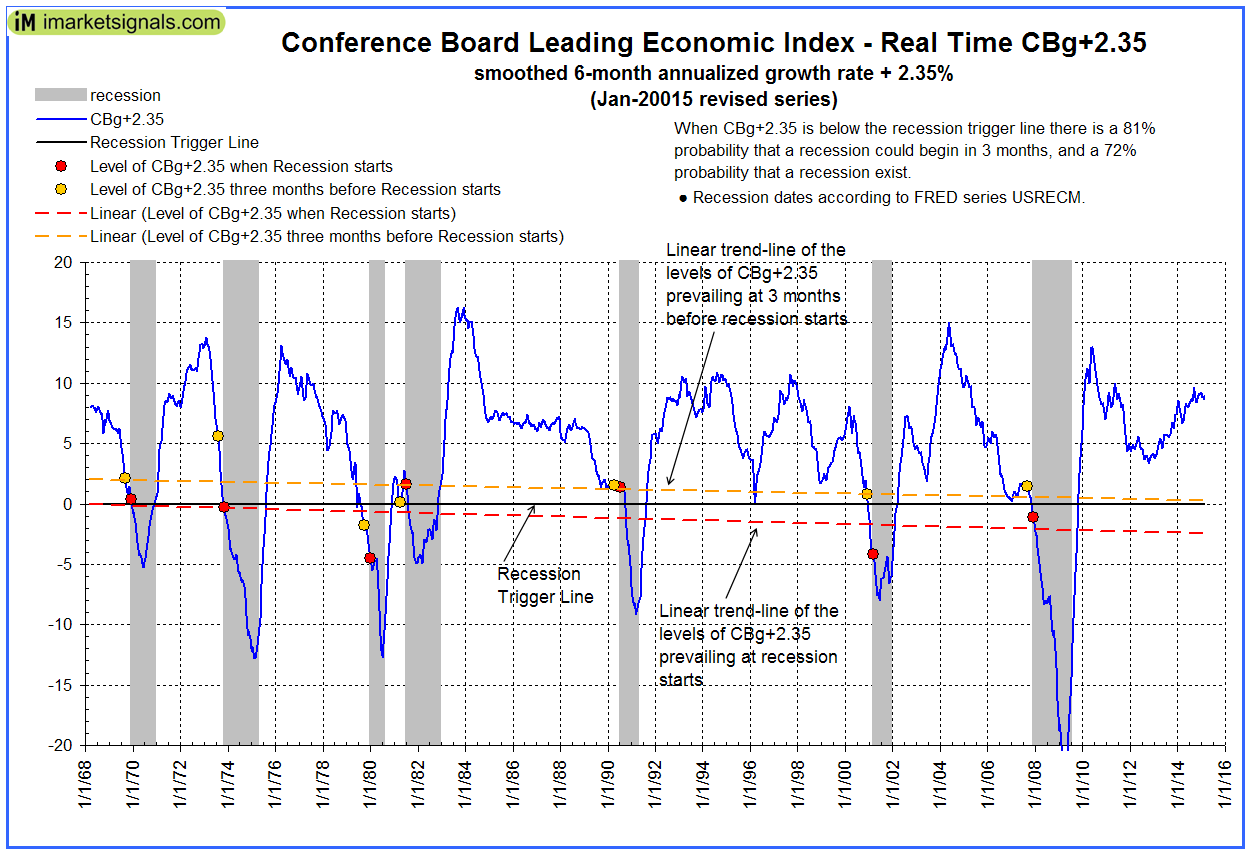
- Leading economic indicators increased 0.5%. While this was in line with expectations, it provides reassurance for those who are worried about a recession. One reason for some skepticism about this index is the history of the series, including various revisions. Doug Short has a post on the comparison of the “new” and “old” methods, showing the long-term gap. Given his conclusions, is there still value in the series? Georg Vrba, continuing his strong quantitative work analyzed the LEI series. Please note that he regards this as inferior to his proprietary methods, which we often cite in the quant corner. His point here is that you can find power from a simple, publicly available data series, if you let the data speak to you.
The Bad
The bad news included some significant economic reports.
- State of the Union. To emphasize, I am not interested in the partisan politics nor am I advocating particular policies. There is a simple test: Is this market-friendly news. The market would celebrate more cooperation, progress on immigration, and corporate tax reform, to pick a few examples. Little of this was expected of the speech, as I noted last week, so there was not much reaction.
- Forward earnings estimates continue to decline. FactSet notes that the forward multiple for the S&P 500 is now 16.6 versus 16.2 at the beginning of the quarter. The forward P/E for the energy sector remains higher than its historical average. Brian Gilmartin tracks the Thomson Reuters series, and reaches a more optimistic conclusion. He sees Q4 growth of 6-6.5%, even after energy haircuts of 4% or so. Charges in the financial stocks have left the picture a bit “murkier” than usual.
- Building permits declined. Calculated Risk, a great source on a complex story, provides some perspective, by focusing on single-family authorizations, up 4.4% from November.
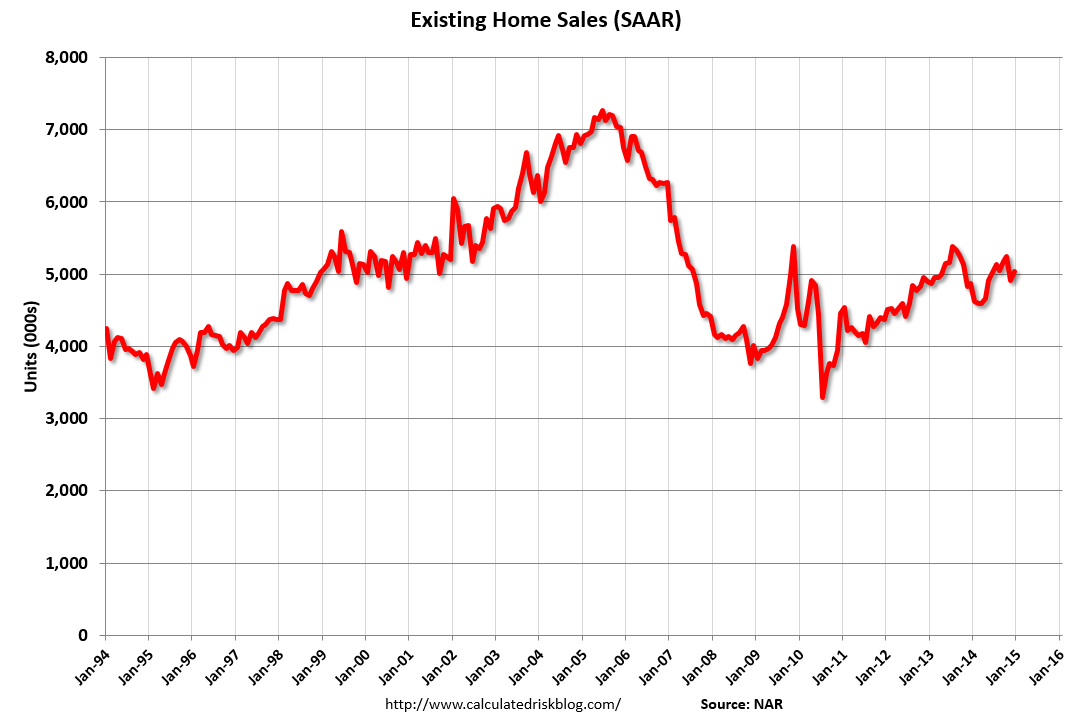
- Existing home sales missed monthly expectations and declined for calendar 2014. There was a reduction in inventory to a 4.4 month supply. Calculated Risk has analysis and charts, including this one:
- Initial jobless claims declined to 307K, but still higher than the recent results. This is a mild negative in a noisy but important series.
The Ugly
The Ukraine conflict. War has exploded anew on multiple fronts. We have been following events with concern about the human toll, but also the growing effect on the world economy and financial markets. The New York Times has a good account. Also important updates from Stratfor via GEI.
Noteworthy
Enthusiasm is an ingredient for success. We can all learn from “everyone’s favorite person” and the “most positive person in any room he entered.” More at the Trib and also the NPR account.
Let’s play two!
The Silver Bullet
I occasionally give the Silver Bullet award to someone who takes up an unpopular or thankless cause, doing the real work to demonstrate the facts. Think of The Lone Ranger. No award this week, but nominations are welcome.
Quant Corner
Whether a trader or an investor, you need to understand risk. I monitor many quantitative reports and highlight the best methods in this weekly update. For more information on each source, check here.
Recent Expert Commentary on Recession Odds and Market Trends
Bob Dieli does a monthly update (subscription required) after the employment report and also a monthly overview analysis. He follows many concurrent indicators to supplement our featured “C Score.”
RecessionAlert: A variety of strong quantitative indicators for both economic and market analysis. While we feature the recession analysis, Dwaine also has a number of interesting market indicators.
Doug Short: An update of the regular ECRI analysis with a good history, commentary, detailed analysis and charts. If you are still listening to the ECRI (three years after their recession call), you should be reading this carefully. Doug has the latest interviews as well as discussion. Also see Doug’s Big Four summary of key indicators.
Georg Vrba: has developed an array of interesting systems. Check out his site for the full story. We especially like his unemployment rate recession indicator, confirming that there is no recession signal. Georg continues to develop new tools for market analysis and timing. Some investors will be interested in his recommendations for dynamic asset allocation of Vanguard funds. Georg has a new method for TIAA-CREF asset allocation. He has added a method for Vanguard Dividend Growth Funds. I am following his results and methods with great interest. You should, too. Georg’s update this week was his BCI index, also showing very low recession changes.
Despite the facts, the average fund manager or trader views oil prices as a recession signal. (MarketWatch)
The Week Ahead
It is back to normal for economic data.
The “A List” includes the following:
- Initial jobless claims (Th). The best concurrent news on employment trends, with emphasis on job losses.
- FOMC rate decision (W). Difficult to imagine fresh news from this, but some will find it.
- Crude oil inventories (W). Attracting a lot more attention these days.
- New home sales (T). Important read on housing sector contribution to the economy.
- Consumer confidence (T). Conference Board version reflects employment and spending trends.
- Michigan sentiment (F). Usually parallels the Conference Board, despite different methods.
The “B List” includes the following:
- Q4 GDP (F). This could be a surprise, but most see it as “old news” that will be revised multiple times.
- Chicago PMI (F). This is the only regional index worth watching because of the correlation with the national ISM index. It has special interest when there is a weekend in between the two.
- Durable goods (T). Important GDP element.
- Pending home sales (Th). It is important to watch all things housing, but this is less significant than new home sales (above).
First Greece, then the Fed, but mostly, attention will focus on earnings reports.
How to Use the Weekly Data Updates
In the WTWA series I try to share what I am thinking as I prepare for the coming week. I write each post as if I were speaking directly to one of my clients. Each client is different, so I have five different programs ranging from very conservative bond ladders to very aggressive trading programs. It is not a “one size fits all” approach.
To get the maximum benefit from my updates you need to have a self-assessment of your objectives. Are you most interested in preserving wealth? Or like most of us, do you still need to create wealth? How much risk is right for your temperament and circumstances?
My weekly insights often suggest a different course of action depending upon your objectives and time frames. They also accurately describe what I am doing in the programs I manage.
Insight for Traders
Last week Felix switched to “neutral” for the three-week market forecast, but I noted that it was a close call. The data have improved a bit, but still marginally neutral. There is still plenty of uncertainty reflected by the high (but declining) percentage of sectors in the penalty box. Our current position is still fully invested in three leading sectors, but these include some defensive themes. For more information, I have posted a further description — Meet Felix and Oscar. You can sign up for Felix’s weekly ratings updates via email to etf at newarc dot com.
As I have noted for three weeks, Felix continues to feature selected energy holdings.
Mike Bellafiore warns about eight ways you can blow up your trading account. My regular readers will recognize warnings about choosing the wrong time frame and excessive size. The point about commission costs is interesting. Before reading the entire article, try to guess the commissions paid by those at Bella’s prop trading firm.
Insight for Investors
I review the themes here each week and refresh when needed. For investors, as we would expect, the key ideas may stay on the list longer than the updates for traders. Major market declines occur after business cycle peaks, sparked by severely declining earnings. Our methods are focused on limiting this risk. We have recently updated our current ideas for investors.
Other Advice
Here is our collection of great investor advice for this week:
Scams
David Merkel has been a champion at warning investors. His latest post on promoted stocks is worth a careful read. I strongly agree, especially about stocks where the company and symbol are advertised on TV or radio.
Stock Ideas
Barron’s has a feature on Where to Find Gains as Profit Slows.
It is also Part 2 of the annual three-part roundtable series. There are a number of diverse opinions about the economy, the market and twenty-two specific stock ideas. Fellow chess players can also tell me if the game on the cover photo could be achieved through actual play.
Brett Arends has the ten most hated stocks. These are given low ratings from analysts (something that we rate as a positive in our own stock evaluations). Here is his comment:
It’s surprisingly diversified, from oil drilling to soup. The price-to-earnings ratios are also surprisingly high for unpopular stocks — you might expect them to be below the market average, which is around 16 times forecast earnings — but companies under a cloud often have artificially depressed earnings. The dividend yields look juicy, but they need to be taken with tablespoon of salt, especially the supposed 10%-plus yields sported by the two drilling companies. Yields that high usually signal that Wall Street expects the dividend to be cut.
Energy Prices
David Kelly, Chief Global Strategist for JP Morgan funds, has an interesting Barron’s column on how to interpret declining energy prices. Here is a key quote:
On oil prices, three things need to be underlined:
First, falling oil prices are not a reliable signal of impending economic weakness. The reality is that the oil plunge was largely caused by a small but growing oversupply in the global market, amplified by OPEC’s unwillingness to offset rising U.S. production and a very significant shift in sentiment among commodity investors. Weak demand from Europe and Japan has slightly exacerbated the oversupply situation. However, the current plunge in prices does not forecast severe economic weakness any more than oil at over $140 a barrel in the summer of 2008 forecasted economic strength.
Second, falling oil prices are an unambiguous positive for the U.S. economy. Despite the surge in fracking activity, the U.S. remains a net oil importer, and falling gasoline prices are having a major impact in boosting both discretionary consumer income and confidence. This is why cheaper oil should, in general, be positive for U.S. stocks.
Third, enjoy it while it lasts, as oil prices are likely to gradually recover. From the start of 2011 to the middle of 2014, Brent crude oil prices generally hovered between $100 and $110 per barrel This gave plenty of time for producers and consumers to adapt to $100 oil. In reaction to a sudden price fall to below $50, consumption will gradually rise and production will gradually fall.
Market Prospects
Adam Parker, Morgan Stanley’s Chief US Equity Strategist, was famously bearish a few years ago. The data have altered his expectations for this year’s stock market to a gain of 11%. He expects this to come from a combination of 6+% earnings growth, 2+% stock buybacks, and 2+% dividends. He makes the interesting point that earnings expectations for the energy sector have declined dramatically. Analysts for sectors that benefit from lower prices may be playing “wait and see.” This is a video worth watching.
The stock market’s fate depends upon the next six days. I understand the demands on people who write lots of columns, but please…… This is just silly. Since the actual story is more balanced, I am hoping that it is another case of editors goosing page view with a misleading headline. Sheesh! Can’t Hulbert complain about this?
Sources of fresh buying for stocks? Business Insider cites Citi’s Investment Themes for 2015.
Schofield writes that these are the biggest secular trends that will drive demand:
High Net Worth individuals have been very wary of equities since the financial crisis, but with the yield on the 10-Year note below 2% and lower in Europe and Japan, they will switch.
Insurance companies will increase their buying after a 15-year selloff because of changes in capital regulation and an increased focus on asset-liability management.
Companies will take advantage of low rates to buy back their stocks.
Investor Psychology
Ben Carlson had another thoughtful observation this week. The theme is difficult to capture, partly because he describes it as “a few random observations.” I liked them and you will too. Especially this one:
Good investment advice will always sound the best and make the most sense when looking back at the past or planning ahead for the future. It will rarely sound so great in the moment when you actually have to use it.
Final Thought
This week’s potential themes all defy prediction. I do not know what will happen in Greece. I question the preliminary analysis of the ECB moves. The earnings stories have been a bit better than market forecasts, but with little reaction.
This may be another case of divergence between the trading and investing time frames. There are plenty of attractive stocks for investors. A cautious approach is to wait until the companies have reported earnings, perhaps missing a percent or two from the bottom. Following our precept of “Take what the market is giving you,” there are continuing opportunities in regional banks, cyclical names, technology, and consumer discretionary. When times are uncertain, it helps to have a shopping list!

