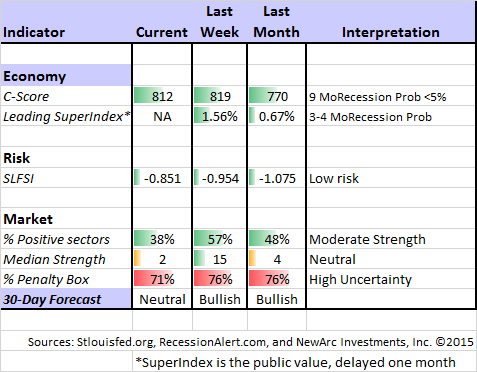
Investors have another holiday-shortened week ahead and a light calendar of economic data. Last week included the “official” start of earnings season, but things are really heating up now.
I expect market participants to be watching closely for The Message from Corporate Earnings.
Prior Theme Recap
In last week’s WTWA I predicted that there would be a focus on the message from the bond market. That was very accurate, even more so if extended to commodity prices which traded in tandem. Some cited copper prices. Brett Steenbarger had the trader perspective on multiple markets. Sober Look inferred a rising risk of deflation. It was a consistent theme on CNBC. Gavyn Davies thinks the commodity markets are right, but that stocks have not incorporated that viewpoint. Interesting.
The stock market I was following seems pretty much in knee-jerk reaction to the commodity news. Hale Stewart has a more balanced conclusion, with an interesting angle on the commodity trading from Chinese hedge funds. Whatever viewpoint you choose, it was a good guess for last week’s theme.
Bond yields moved lower still, but the explanations remained varied. Michael Aneiro at Barron’s Current Yield captures all of the factors:
New reasons for yields to fall keep coming from all directions on a seemingly daily basis. Early last week the World Bank cut its forecast for global growth, and Treasury yields fell. On Wednesday, the Commerce Department reported that U.S. retail sales fell by 0.9% in December, the sharpest drop in a year, and Treasury yields fell. On Thursday, Switzerland’s central bank ended a longstanding exchange-rate cap, causing the Swiss franc to soar versus the euro, boosting safe-haven investments and causing Treasury yields to fall.
Feel free to join in my exercise in thinking about the upcoming theme. We would all like to know the direction of the market in advance. Good luck with that! Second best is planning what to look for and how to react. That is the purpose of considering possible themes for the week ahead.
This Week’s Theme
There is much less economic news in the holiday-shortened week ahead. The State of the Union Address will attract some attention on Tuesday evening, but there is a lot of advance information. The ECB will announce QE plans on Thursday, but that is also widely anticipated.
I expect the real focus for the week to be corporate earnings – always important, but now even more so. Analyst expectations are dropping rapidly. (Bespoke).
- Outlook. Will corporations express greater worries about Europe and China or some confidence in future prospects. FactSet reports that 84% of companies have beaten expectations so far. Guidance is 4-2 positive (yes, only six cases). It does not feel like it was very good. Market standards seem demanding.
- Energy companies. Are the earnings for this sector (and by implication the overall market) overstated? This could prompt some revised thinking. Earnings expert Brian Gilmartin remains confident about earnings growth ex-energy, looking for a year-over-year gain of 6.7%. He is more cautious about energy.
- Energy cap-ex and employment. There has already been a move to attribute the bulk of employment gains to growth in the U.S. energy business – direct and indirect. Any job cuts will get highlighted as evidence, as was the case in the Schlumberger NV (NYSE:SLB) report.
As always, I have some additional ideas in today’s conclusion. But first, let us do our regular update of the last week’s news and data. Readers, especially those new to this series, will benefit from reading the background information.
Last Week’s Data
Each week I break down events into good and bad. Often there is “ugly” and on rare occasions something really good. My working definition of “good” has two components:
- The news is market-friendly. Our personal policy preferences are not relevant for this test. And especially – no politics.
- It is better than expectations.
The Good
There was a normal news week, with a negative tilt.
- A government shutdown is “off the table” according to Senate Republicans. This removes one significant market worry. (The Hill).
- An advisory European Court gave a preliminary OK to the ECB’s quantitative easing plan, (BreakingViews). Normally I would not even mention this, but Art Cashin said that people would be checking the news at 4 AM. The positive story did not seem to help that day’s trading! Many remain skeptical on the plan because of expected limitations. (FT).
- CPI increases remain low. Brian Wesbury has a complete analysis showing that the results would be even lower without items like imputed rent.
- Industrial production registered a slight beat.
- Job openings reached another multi-year high. The market is treating this as a positive, so I’ll call it “good,” but the number of quits declined again. Most would be surprised to learn that 2.6 million people voluntarily left jobs last month. (BLS).
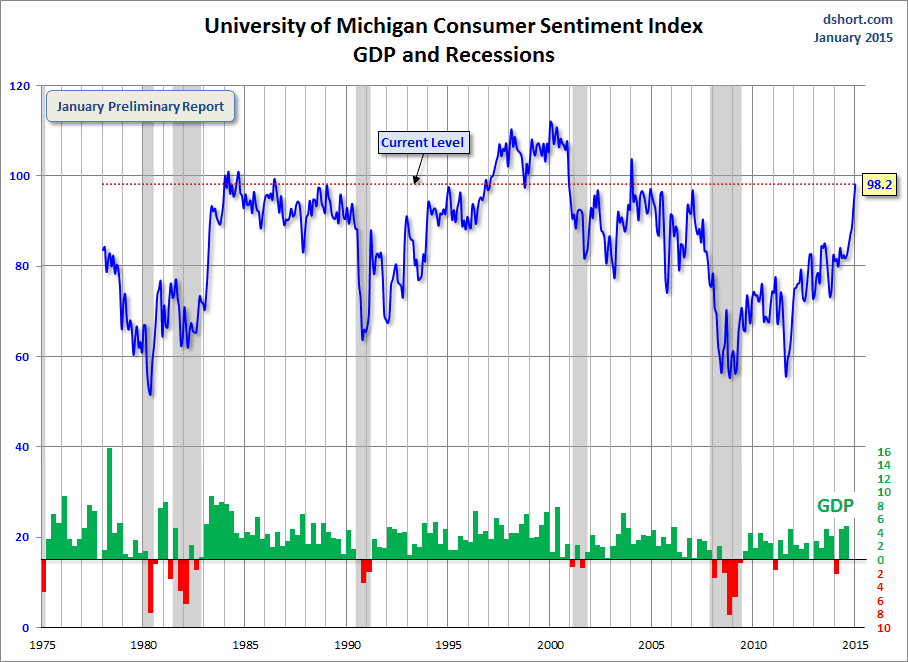
- Michigan sentiment hit an 11-year high with a reading of 98.1. This has been a good coincident indicator for employment and consumption, so perhaps the lower gas prices are having an effect. Doug Short’s chart of this is still the best, drawing together all of the key factors and providing a good historical perspective.
The Bad
The bad news included some significant economic reports.
- State of the Union – early leaks. I may be jumping the gun a bit here, but the prospects for Tuesday’s SOTU address do not seem market-friendly. I have been hoping for a spell of coalition-building requiring a bit of bipartisan cooperation. The early hints about the speech suggest a more aggressive theme. Sometimes these are trial balloons, so we shall see. (Washington Post).
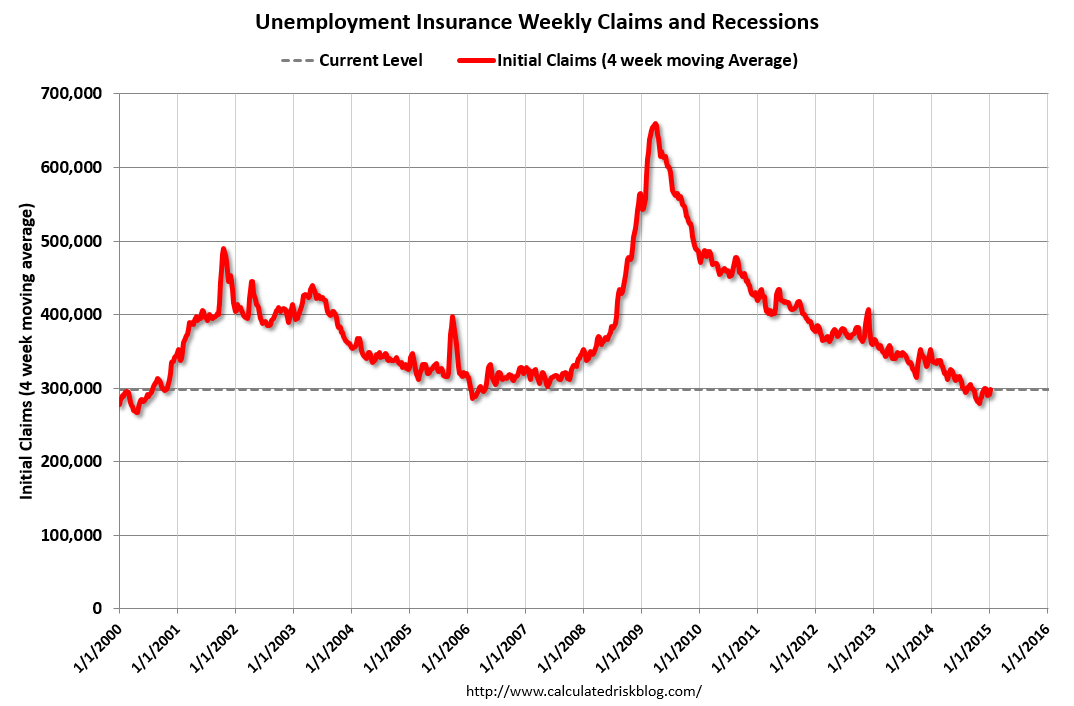
- Initial jobless claims rose to 316K, a recent high, as did the four-week moving average. We all watch this closely. Calculated Risk has the story as well as a helpful chart.
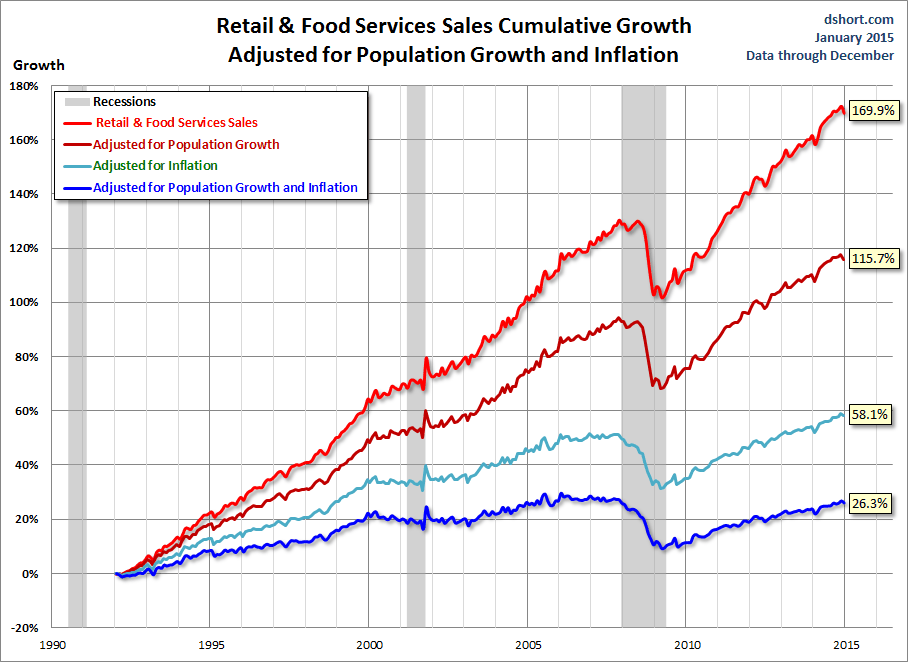
- Retail sales declined by 0.9%, much worse than expectations. Scott Grannis notes the impact of reduced gasoline sales and cites the ex-gasoline number as a decline of 0.3%. Doug Short adjusts for both population and inflation, producing a much more pessimistic picture.
The Ugly
The Swiss revaluation fallout. John Lounsbury explains why the actual economic impacts are modest. Not so the impacts on traders who got buried on highly-leveraged bets on the currency relationships. This is what happens when you are trying to make big returns on a very slight edge. Some immediately looked for falling dominoes of the Lehman variety. The FT has an objective account of motivations. We would do better to look for other crowded hedge fund trades that could easily go wrong. Jeremy Hill describes four trends that have a wide trader following, calling them “blackjack trades” because they are “double down, double up.” Which of the four stands on its own merits?
Noteworthy
My email forwarding service sent out an old item last week, for no apparent reason. The service was originally Feedburner, but it has been purchased by Google. Our only explanation is that it was a warning shot because of last week’s little joke: “Google is moving into the auto insurance business. Isn’t the company also pushing a driverless car? Coincidence no doubt!” It’s not nice to poke fun at Google!
The Silver Bullet
I occasionally give the Silver Bullet award to someone who takes up an unpopular or thankless cause, doing the real work to demonstrate the facts. Think of The Lone Ranger. No award this week, but nominations are welcome.
Fans of the Silver Bullet can check out our annual review of award winners, just in case you missed one. Most investors have been bamboozled by one or more of these stories, so an annual review can be helpful.
Quant Corner
Whether a trader or an investor, you need to understand risk. I monitor many quantitative reports and highlight the best methods in this weekly update. For more information on each source, check here.
Recent Expert Commentary on Recession Odds and Market Trends
Bob Dieli does a monthly update (subscription required) after the employment report and also a monthly overview analysis. He follows many concurrent indicators to supplement our featured “C Score.”
RecessionAlert: A variety of strong quantitative indicators for both economic and market analysis. While we feature the recession analysis, Dwaine also has a number of interesting market indicators.
Doug Short: An update of the regular ECRI analysis with a good history, commentary, detailed analysis and charts. If you are still listening to the ECRI (three years after their recession call), you should be reading this carefully. Doug has the latest interviews as well as discussion. Also see Doug’s Big Four summary of key indicators.
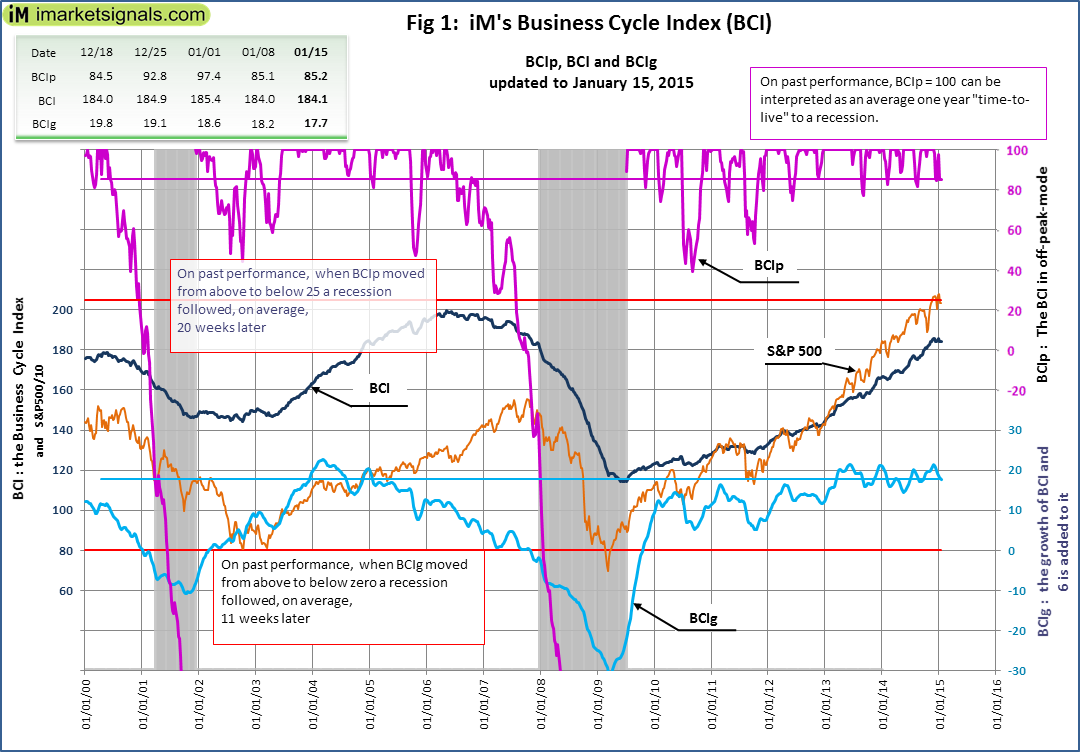
Georg Vrba: has developed an array of interesting systems. Check out his site for the full story. We especially like his unemployment rate recession indicator, confirming that there is no recession signal. Georg continues to develop new tools for market analysis and timing. Some investors will be interested in his recommendations for dynamic asset allocation of Vanguard funds. Georg has a new method for TIAA-CREF asset allocation. He has added a method for Vanguard Dividend Growth Funds. I am following his results and methods with great interest. You should, too. Georg’s update this week was his BCI index, also showing very low recession changes.
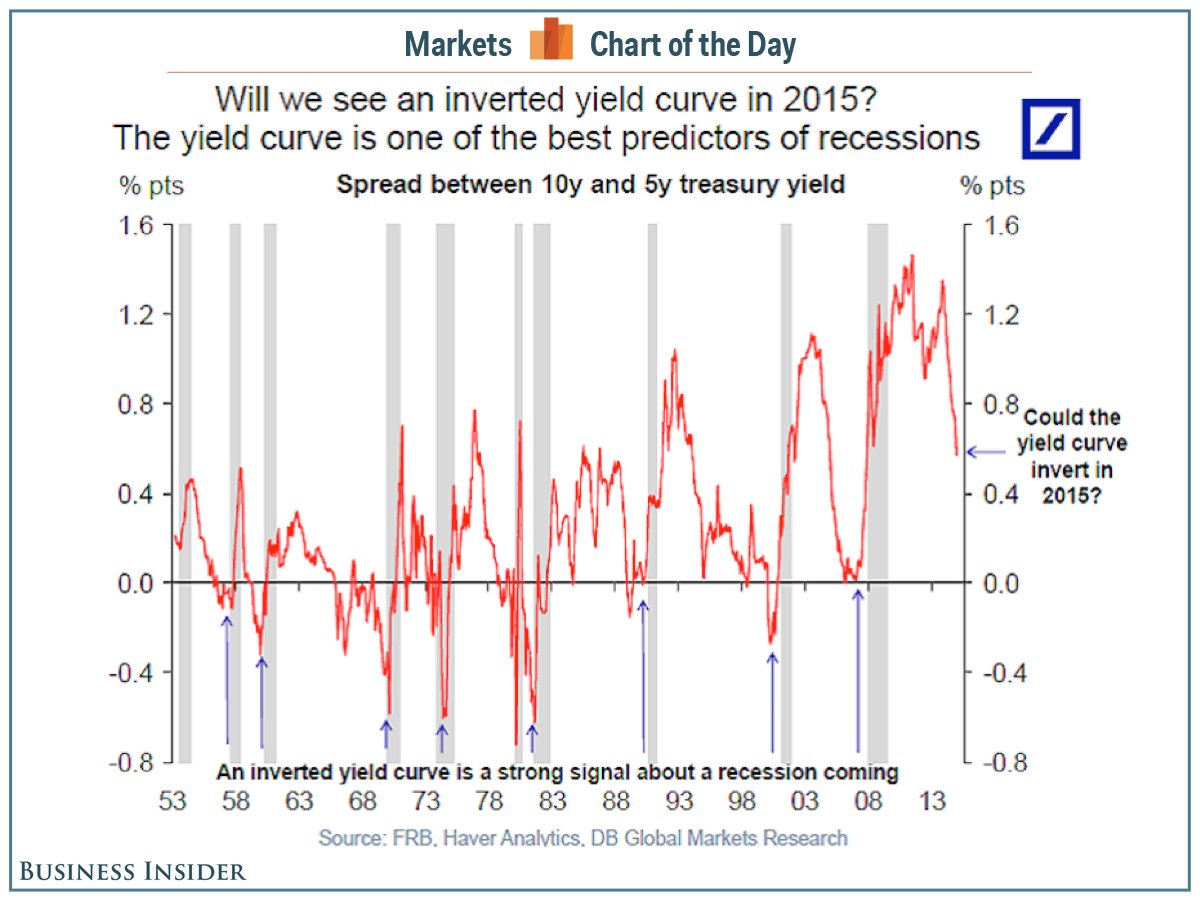
Myles Udland at Business Insider, a source we cite frequently, has a story about a potential inversion of the yield curve, which is supposedly “rapidly approaching” a recession signal. I am including the chart for consideration. I wish that Myles would give equal time to the first-rate recession sources I have been featuring for almost four years. A balanced account would include those who have been accurate. Each of them considers the yield curve as part of the modeling. All do a better job than Udland’s source.
The Week Ahead
It is a light week for economic data, but there are some important releases.
The “A List” includes the following:
- Initial jobless claims (Th). The best concurrent news on employment trends, with emphasis on job losses.
- Housing starts and building permits (W). Follow permits for a leading indicator on this important sector.
- Leading indicators (F). Somewhat controversial but widely followed.
- Crude oil inventories (Th). Attracting a lot more attention these days.
The “B List” includes the following:
- Existing home sales (F).
- Chinese economic data (T). Q4 GDP, industrial production, and retail sales.
One wild card might be the State of the Union speech on Tuesday night. The market would welcome credible ideas about tax reform, for example.
Mostly, attention will focus on earnings reports.
How to Use the Weekly Data Updates
In the WTWA series I try to share what I am thinking as I prepare for the coming week. I write each post as if I were speaking directly to one of my clients. Each client is different, so I have five different programs ranging from very conservative bond ladders to very aggressive trading programs. It is not a “one size fits all” approach.
To get the maximum benefit from my updates you need to have a self-assessment of your objectives. Are you most interested in preserving wealth? Or like most of us, do you still need to create wealth? How much risk is right for your temperament and circumstances?
My weekly insights often suggest a different course of action depending upon your objectives and time frames. They also accurately describe what I am doing in the programs I manage.
Insight for Traders
Felix held a bullish stance throughout the week, despite the continuing turbulence. There is still plenty of uncertainty reflected by the extremely high percentage of sectors in the penalty box. There has also been some rapid changes in the top sectors. Our current position is still fully invested in three leading sectors, but Felix’s overall market rating has slipped a bit. We’ll downgrade it to neutral in our regular “month ahead” forecast, but it is a close call. For more information, I have posted a further description — Meet Felix and Oscar. You can sign up for Felix’s weekly ratings updates via email to etf at newarc dot com.
As I have noted for two weeks, Felix continues to feature selected energy holdings.
Joe Fahmy has advice for biotech traders, and it is quite good – start with ETFs and the larger names until you have done more research. His comments, especially about position size, have a much wider application. Many traders blow out by getting too big. The go by what they want to earn, not by what they can risk. The also under-estimate risk.
Insight for Investors
I review the themes here each week and refresh when needed. For investors, as we would expect, the key ideas may stay on the list longer than the updates for traders. Major market declines occur after business cycle peaks, sparked by severely declining earnings. Our methods are focused on limiting this risk. We have recently updated our current ideas for investors.
Other Advice
Here is our collection of great investor advice for this week:
Sectors and ETFs
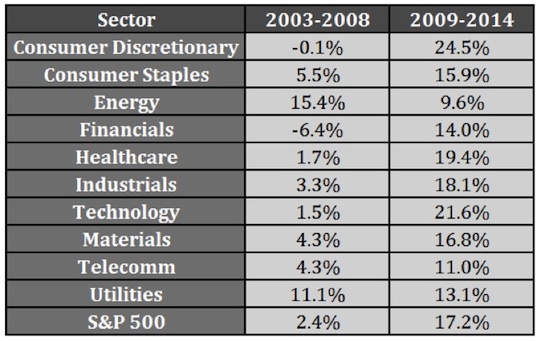
Ben Carlson has a great article analyzing winning sectors from past years and changing trends. There are many good charts and he suggests several lessons. Here is one chart to consider. Meanwhile, my forecast is that last year’s winners will be this year’s losers and vice-versa. One unusual year begets another.
Stock Ideas
Goldman’s 18 most expensive stocks.
- CNBC had a great interview with leading fund manager Noah Blackstein. While the topic is listed as opportunities in Canadian stocks, Noah explained an interesting trade he has noted. Funds are going long debt in energy companies and short the stocks. This is working for the moment, but could shift quickly. This is an interesting observation from a savvy observer.
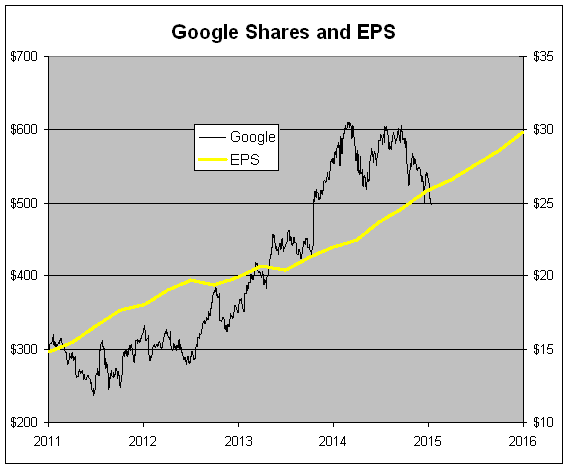
- Eddy Elfenbein provides some thoughts about Google (NASDAQ:GOOGL), including the chart below. As is often the case, I agree with his Google analysis. It is a good time for the company to show what P/E multiple is justified. (We do not yet own it for most clients, but it is on our watch list). More importantly, Eddy’s clear-headed analysis and great graphic representation show how value investors pick stocks.
- Value in long-term MLP’s? (WSJ)
Energy Prices
- Short-term a 5% oil rally on Friday. Signs of a bottom?
- Long-term energy prospects related to China. Car ownership is 70 per 1000 population. In the US it is 800. Car ownership relates strong to GDP per capita, so you can do the math. Paulo Santos has a nice article with good evidence and some interesting charts.
Market Prospects
Economist David Rosenberg says that it is “hard to be bearish on stocks.” I have special respect for those who are led by data, willing to adjust opinions. He has lost some loyal followers from the perma-bear community (although apparently still invited to the Mauldin conference). Take a few minutes to watch the video.
Investor Psychology
I was surprised that there was little mention of the logic problem from last week. Was it too easy for our sophisticated readership?
Buttonwood reminds us of how easy it is to confuse skill and luck. Try your hand at this quiz (which 80% get wrong) as well as the key takeaway:
Jack is looking at Anne but Anne is looking at George. Jack is married, but George is not. Is a married person looking at an unmarried person? A) Yes, B) No or C) cannot be determined.
Answer in the conclusion.
Final Thought
I do not know how earnings season will play out this week. My list of things to watch is good, but the market seems to be demanding a parlay of positive indications:
- Beating the whisper number for earnings;
- Beating the revenue expectations;
- Business growth –organic, not from mergers or purchases;
- Solid “quality of earnings” with no gimmicks or accounting moves;
- A credible, positive outlook.
These are always factors, but the early returns suggest the bar is high this quarter. Markets are looking to earnings reports for any sign that the economy has weakened.
Puzzle solution. Most think that the information is not enough to reach a conclusion. They answer is actually “Yes.” Try considering both cases – Anne married and not married.

