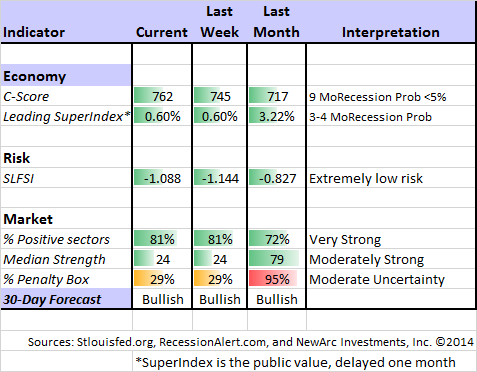
Last week’s economic data included many reports but a similar message: Continuing growth, but a touch less than hoped for.
The big news came from the energy markets and the plunge in oil prices after the OPEC meeting. The knee-jerk reaction was to sell anything related to energy. This is surprising for several reasons:
- The failure of OPEC to reach an agreement to curtail production was widely expected. Last week we found few taking the other side (although you can now expect some to claim victory after the fact). This is a classic case of information being “in the market.” When this happens we usually expect to see buy the rumor and sell the news (or the opposite in this case). Instead, the trading reaction was negative—and not just by a little.
- The selling in energy names was indiscriminate. Lower oil prices might be good for (some) refiners, for example, but they declined as well. Major integrated oil companies might be able to replenish reserves at lower cost. There was no analysis of this.
- Many traders do not have access to futures markets. As a result they trade energy ETFs as a proxy.
I am expecting the week ahead to embrace three different themes:
- A day or two of digestion – the OPEC meetings and economic data, with the “A Teams” back on the trading desks. We will also see some analyst reports that highlight the discrepancies I have noted above. That should get us through Tuesday.
- A switch to the old standby – the Fed – as the beige book appears and pundits ponder the upcoming jobs report.
- A late-week focus on jobs data. A key theme is whether good news about the economy will finally be good news for the market.
To summarize: This week is a time for digestion.
A Personal Message
Last week I offered some thanks to all of those who have helped us achieve a successful year. I also mentioned that I might take the weekend off or do an abbreviated version as we enjoyed some family time.
I am trying to do the small version. My hope is that the abbreviated version is better than nothing. I always track everything going on and use it in my own planning. At the margin, I sometimes do not have time to write. Putting thoughts to pixels and (especially) providing the best of my supporting sources adds several hours to the post each week.
I hope that readers will find this abbreviated version to be helpful. If it is, I will try to repeat this approach on the other few occasions when I might otherwise miss completely.
I am hitting the high spots on last week’s news, but I have included the updates on Felix and some investment ideas, including my own conclusions.
Readers, especially those new to this series, will benefit from reading the background information.
Last Week’s Data
Each week I break down events into good and bad. Often there is “ugly” and on rare occasion something really good. My working definition of “good” has two components:
- The news is market-friendly. Our personal policy preferences are not relevant for this test. And especially – no politics.
- It is better than expectations.
Overall News Summary
Last week’s economic news was mixed. Most of the reports (initial jobless claims, consumer sentiment, and durable goods) were small disappointments or marginal gains. There was no change to the general summary of modest growth.
Housing data was also mixed. New home sales beat expectations while pending sales disappointed. As always, I strongly recommend reading every report from Calculated Risk on all things housing. Here are Bill’s comments on new home sales, where he expects continuing increases.
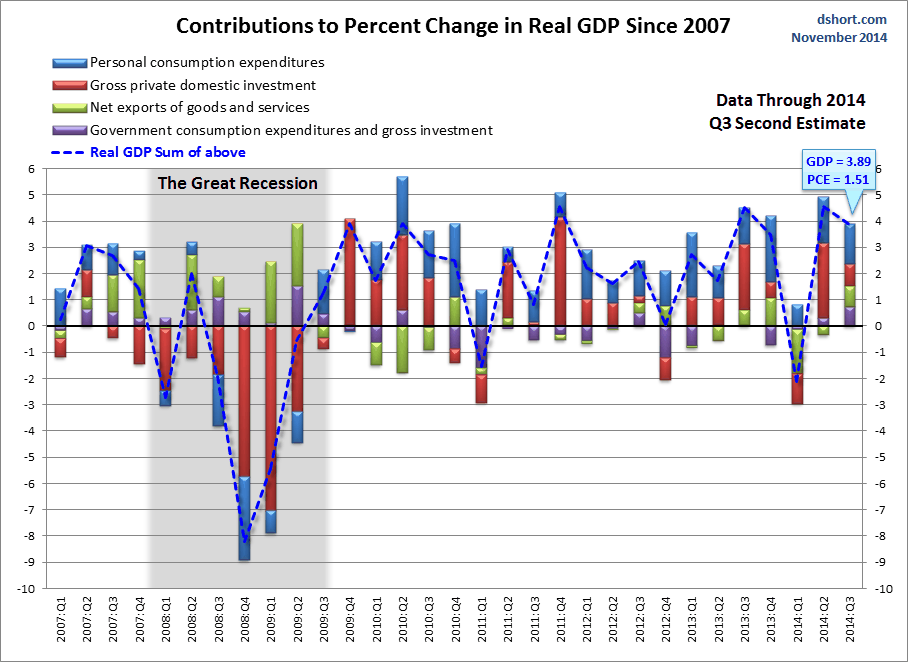
The best news was from GDP, surprisingly revised higher to 3.9% for Q3. This is a backward look, but it does provide the foundation for future expectations. I especially enjoy Doug Short’s analysis of the components of GDP growth.
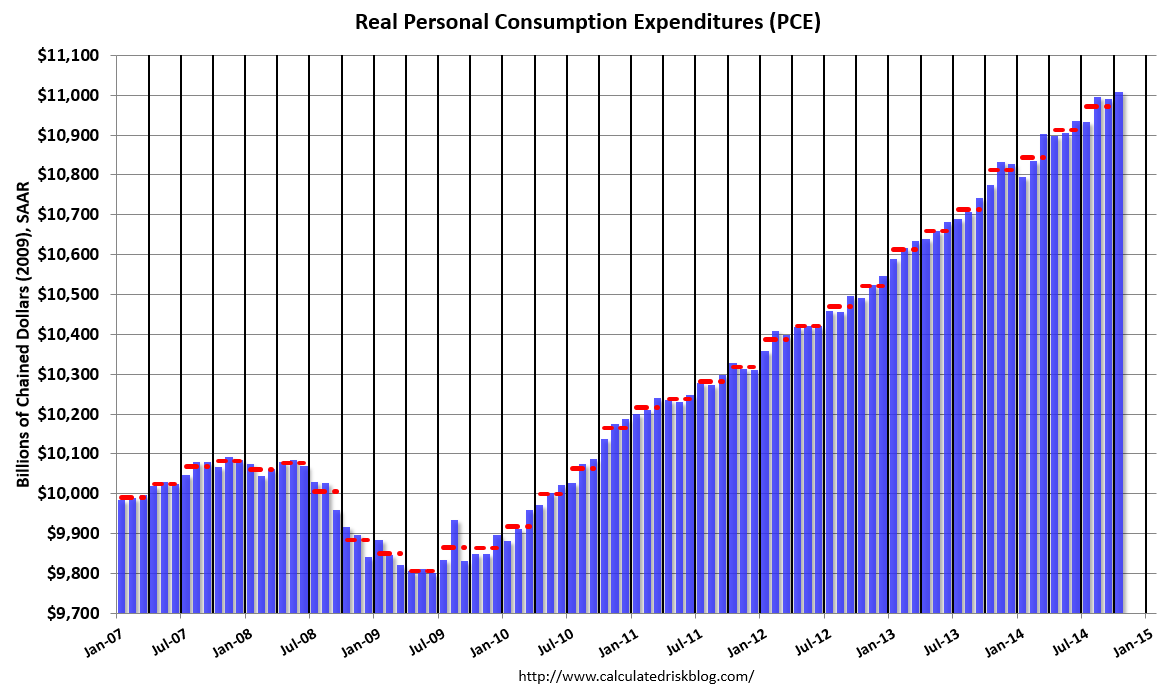
The worst news was from personal income and spending, growing significantly below expectations. This was officially a disappointment. Calculated Risk (as always) has a great chart to keep things in context.
The Ugly
The reaction in all things energy.
The Silver Bullet
I occasionally give the Silver Bullet award to someone who takes up an unpopular or thankless cause, doing the real work to demonstrate the facts. Think of The Lone Ranger. No award this week. Nominations welcome!
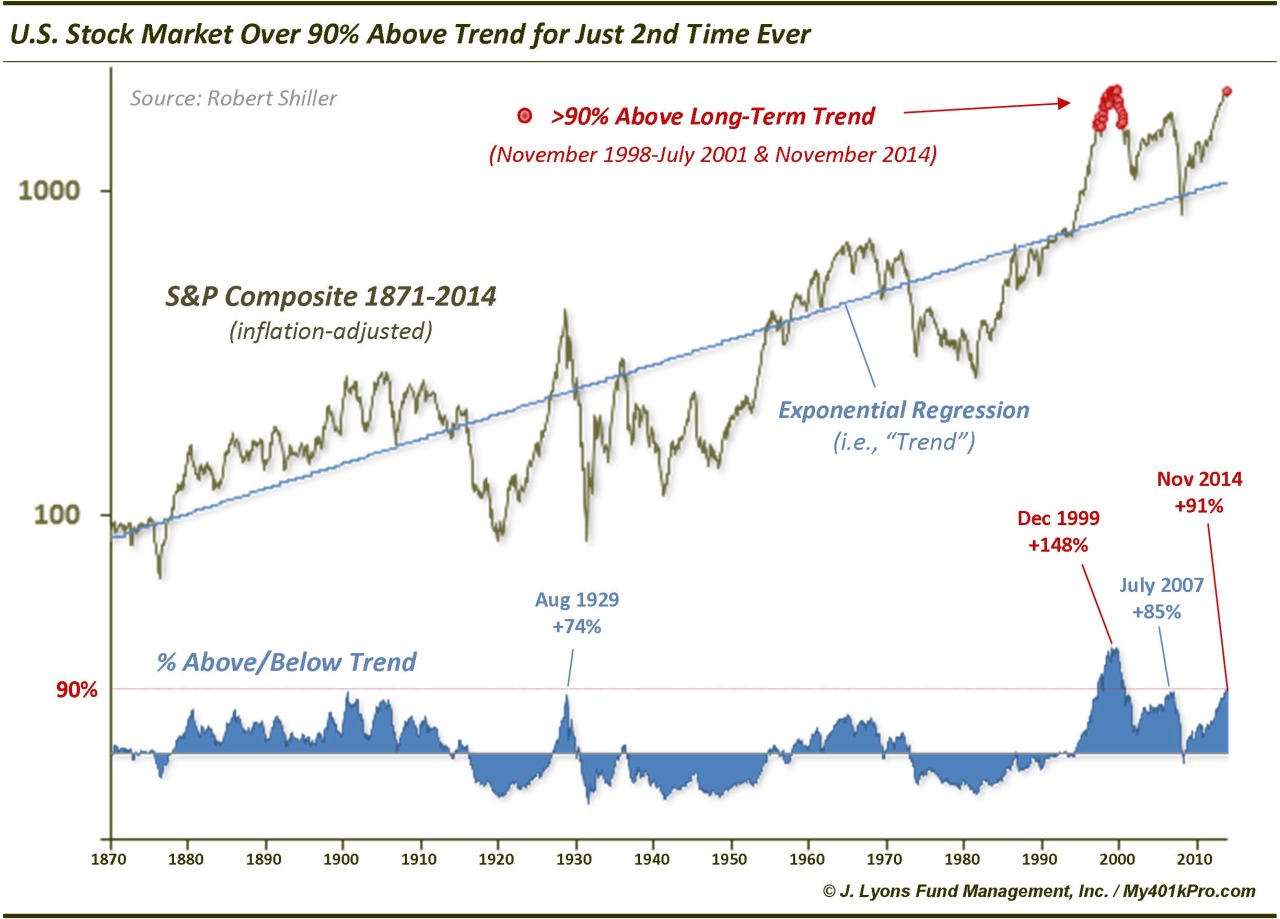
A good candidate would be someone who explains the multiple errors in this chart, which has gained a lot of publicity in the last week:
Quant Corner
Whether a trader or an investor, you need to understand risk. I monitor many quantitative reports and highlight the best methods in this weekly update. For more information on each source, check here.
Recent Expert Commentary on Recession Odds and Market Trends
Doug Short: An update of the regular ECRI analysis with a good history, commentary, detailed analysis and charts. If you are still listening to the ECRI (three years after their recession call), you should be reading this carefully. This week there is (yet another) change in the ECRI story. See also his regular updates to the “Big Four” economic indicators important for official recession dating.
Georg Vrba: has developed an array of interesting systems. Check out his site for the full story. We especially like his unemployment rate recession indicator, confirming that there is no recession signal. Georg’s BCI index also shows no recession in sight. Georg continues to develop new tools for market analysis and timing. Some investors will be interested in his recommendations for dynamic asset allocation of Vanguard funds. Georg has a new method for TIAA-CREF asset allocation. I am following his results and methods with great interest.
Bob Dieli does a monthly update (subscription required) after the employment report and also a monthly overview analysis. He follows many concurrent indicators to supplement our featured “C Score.”
RecessionAlert: A variety of strong quantitative indicators for both economic and market analysis. While we feature the recession analysis, Dwaine also has a number of interesting market indicators.
This week Dwaine has a new post on valuation, refuting some of the arguments about “nosebleed levels.” Check it out. Dwaine concludes:
We have a far better stock market valuation model to manage investment risk, one which can forecast forward two-year returns with a correlation coefficient of 0.65 (amazing for this short span of time), and which is surprisingly adept at warning of bear markets and recessions. This we will cover for subscribers in our December research note in the Research main menu.
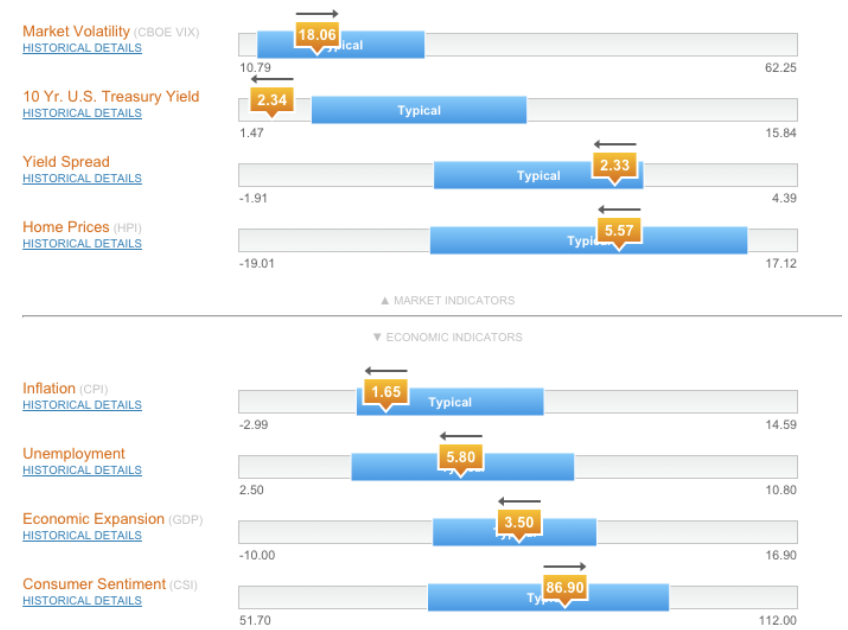
Russell Investments has a monthly economics dashboard, regularly highlighted by Barry Ritholtz. I am showing the snapshot below for illustration, but you can check out the interactive version at The Big Picture.
The Week Ahead
This is an important week for new data. Plenty to digest!
The “A List” includes the following:
- ISM index. (M). While manufacturing is becoming a smaller part of the economy, it remains a good read on overall growth and employment.
- Auto sales (T). One of the best concurrent indicators of current economic activity. Now that the new model is out, the F150 indicator will be watched closely.
- Initial jobless claims (Th). The best concurrent news on employment trends, with emphasis on job losses. Not the same period as Friday’s report.
- Employment report (F). Despite the wide error band in the surveys, and the need for frequent revisions, market observers emphasize this report.
The “B List” includes the following:
- ADP employment (W). A good alternative measure of private employment.
- Beige book (W). Anecdotal evidence to be considered at the next FOMC meeting.
- ISM services (W). Important part of the economy but less historical baseline than the manufacturing brother.
- Crude oil inventories (W). Promoted in importance given the current interest.
- Construction spending (T). October data, but construction is important.
- Factory orders (F). Volatile series, likely to be overshadowed by the jobs report.
- Trade balance (F). This will be interesting on several fronts – GDP adjustment, effect of oil prices, and the effect of the stronger dollar.
The speechifying does not feature the Fed this week. IMF Director Lagarde is on the calendar for Monday, but most of the remaining schedule emphasizes the political. We will also get updated reports on Black Friday and plenty of anecdotal commentary on holiday shopping.
How to Use the Weekly Data Updates
In the WTWA series I try to share what I am thinking as I prepare for the coming week. I write each post as if I were speaking directly to one of my clients. Each client is different, so I have five different programs ranging from very conservative bond ladders to very aggressive trading programs. It is not a “one size fits all” approach.
To get the maximum benefit from my updates you need to have a self-assessment of your objectives. Are you most interested in preserving wealth? Or like most of us, do you still need to create wealth? How much risk is right for your temperament and circumstances?
My weekly insights often suggest a different course of action depending upon your objectives and time frames. They also accurately describe what I am doing in the programs I manage.
Insight for Traders
Felix continued the profitable bullish posture for another week. There is excellent (but diminishing) breadth among the strongest sectors. Ratings have gotten a bit lower, but are still quite solid in many sectors. Felix does not anticipate tops and bottoms, but responds pretty quickly when there is evidence of a change. The penalty box can be triggered by extremely high volatility and volume. It is similar to a trading stop, but not based only on price. There has been quite a bit of shifting at the top, so we have done some trading.
You can sign up for Felix’s weekly ratings updates via email to etf at newarc dot com.
Insight for Investors
I review the themes here each week and refresh when needed. For investors, as we would expect, the key ideas may stay on the list longer than the updates for traders. The recent “actionable investment advice” is summarized here.
Whenever there is a market decline, we are bombarded with “explanations” and predictions of disaster. To keep perspective I wrote a section recently covering these three points:
- What is not happening;
- Factors most often linked to major market moves; and
- The best strategy for the current market.
If you missed this section from a few weeks ago, I urge you to check out the Investor Section of the earlier WTWA. Taking advantage of what the market is giving you is always a good strategy.
Other Advice
For several weeks I have been emphasizing the need to start with your own valuation for stocks and then consider your choices. Too many are making the mistake of starting with current market prices. If you think the market is efficient, you should just buy index funds. If you do not, then what is the “message of the market”?
With that in mind, here are some ideas from value investors:
- Another strong piece from Morgan Housel, who talks about how the pros do valuation. For one thing, it involves plenty of assumptions about unknowable factors. Here is an example of his thinking:
When a stock goes up or down, even by a few percentage points, there’s a tendency to think the market is trying to tell you something. That it’s signaling your company is worth less, or more, than it was a day ago, or a few weeks ago.
But that’s rarely the case.
The majority of stock movements are just random wobbles within a reasonable valuation range. Apple shares falling from $116 to $112 might not mean anything at all. It might just mean that shares are probably worth something between $110 and $120, and anything within that range means more or less the same thing.
- A Barron’s feature with Oakmark’s Bill Nygren discusses how to find value in the current market and features his top picks. We own two of his top six (Oracle Corporation (NYSE:ORCL) and JPMorgan Chase & Co (NYSE:JPM)). There are other suggestions for financials and tech stocks.
- The flip side! Here were the ten worst ETFs from last year. The most amazing example is losing on natural gas whether you went long or short.
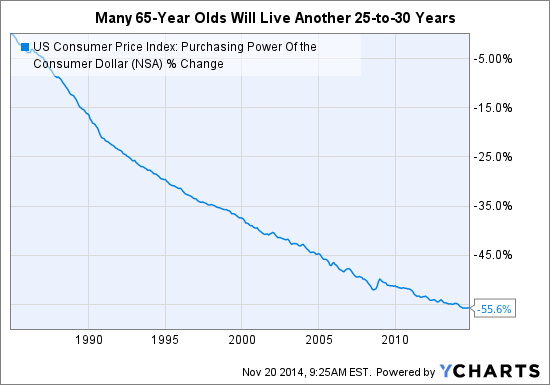
- Don’t forget the effects of inflation. Investors who are 65 lose track of what even modest inflation can do to their portfolios. The excellent YCharts analysis consistently provides key information, including this chart:
Final Thought
I really liked my complacency theme last week and the tug-of-war analogy. It captures the flavor of the overall market commentary, even though it did not get special emphasis last week. Those who have been consistently wrong about market direction and risk have now switched gears, trying to introduce new worries. For this reason I am repeating below the list of worries I am monitoring. I invite you to add your own.
For the week ahead, I am looking for two investment themes (some of which I implemented on Friday, since I was at work):
- Companies benefiting from lower energy prices, where the full advantage is not already priced in.
- Stocks in the energy complex that have been dragged down unfairly – stronger drillers, refiners, integrated oil.
Here is the repeated commentary about vigilance and complacency:
It is vital to avoid complacency, asking what would change your mind. My sense is that most of those using the “C word” never ask about what might convince them to reach a different conclusion.
In July I did an extensive analysis of the potential for a mid-course correction. This included a list of things to watch for as downside risk. In later posts I highlighted the potential for upside surprises.
The key word here is “surprise.” There is no investment edge from repeating what you read in the morning paper. Here was my list – still worth watching:
Geo-political that is not on the current radar – a true black swan.
An increase in the PCE index that was not accompanied by strong economic growth.
Wage increases that were not accompanied by strong economic growth.
Declining profit margins that were not accompanied by strong economic growth and increased revenues.
An increase in the chances for a business cycle peak (the official definition of a recession). Remote at this point.
An increase in financial stress to our trigger point. Remote at this point.
If you have a good list of concerns to monitor you may count yourself as vigilant, not complacent.
Which stock should you buy in your very next trade?
AI computing powers are changing the stock market. Investing.com's ProPicks AI includes 6 winning stock portfolios chosen by our advanced AI. In 2024 alone, ProPicks AI identified 2 stocks that surged over 150%, 4 additional stocks that leaped over 30%, and 3 more that climbed over 25%. Which stock will be the next to soar?
Unlock ProPicks AI
