Executive Summary:
After the best return for the month of August since 1984 (+7.0% for S&P 500 and +7.19% with dividends reinvested) it appears that the trend is indeed an investor's best friend here. And while it's been a little bumpy, the venerable chip index sports a gain of +8.3% year-to-date. However, it is important to remember that you need to have exposure to mega-cap tech in this market to be smiling at month's end. Lest we forget, the iShares Russell 2000 (NYSE:IWM) (using IWM as a proxy) is still down 5.6% on the year and the mid caps (MDY (NYSE:MDY)) are off -5.8%. The reason for the divergence between the S&P and the small- and mid-caps is simple and by now quite obvious: the companies that are growing in the COVID world are being bought,, while the rest are not. And the bottom line is this trend is likely to continue until investors can get a handle on when to expect a vaccine to be widely available.
State Of Trend Indicators
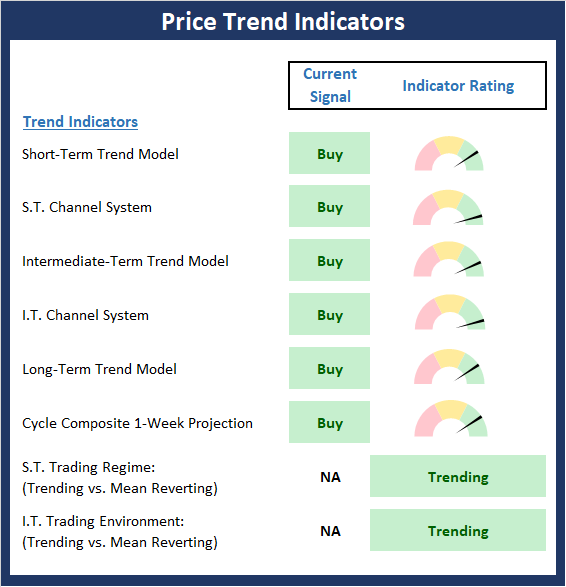
The Trend board scores a perfect 10.0 once again this week as all the models/indicators are both on buy signals and rated positively. So, as I've been saying, from a weight-of-the-evidence standpoint, the message from the board remains pretty darn positive.

About The Trend Board Indicators: The models/indicators on the Trend Board are designed to determine the overall technical health of the current stock market trend in terms of the short- and intermediate-term time frames.
To review, my take on the state of the market trend is that due to the COVID world we now live in, the universe of companies that can "grow" earnings is much smaller than normal. In addition, those companies growing in this environment are doing so even more strongly than normal. Next, it is important to recognize that the pool of capital looking to invest in "market leadership" is larger than ever. As such, the concentration in the COVID winners, while continuing to be extraordinary, makes sense in this "new normal" world.
My Take On State Of The Charts
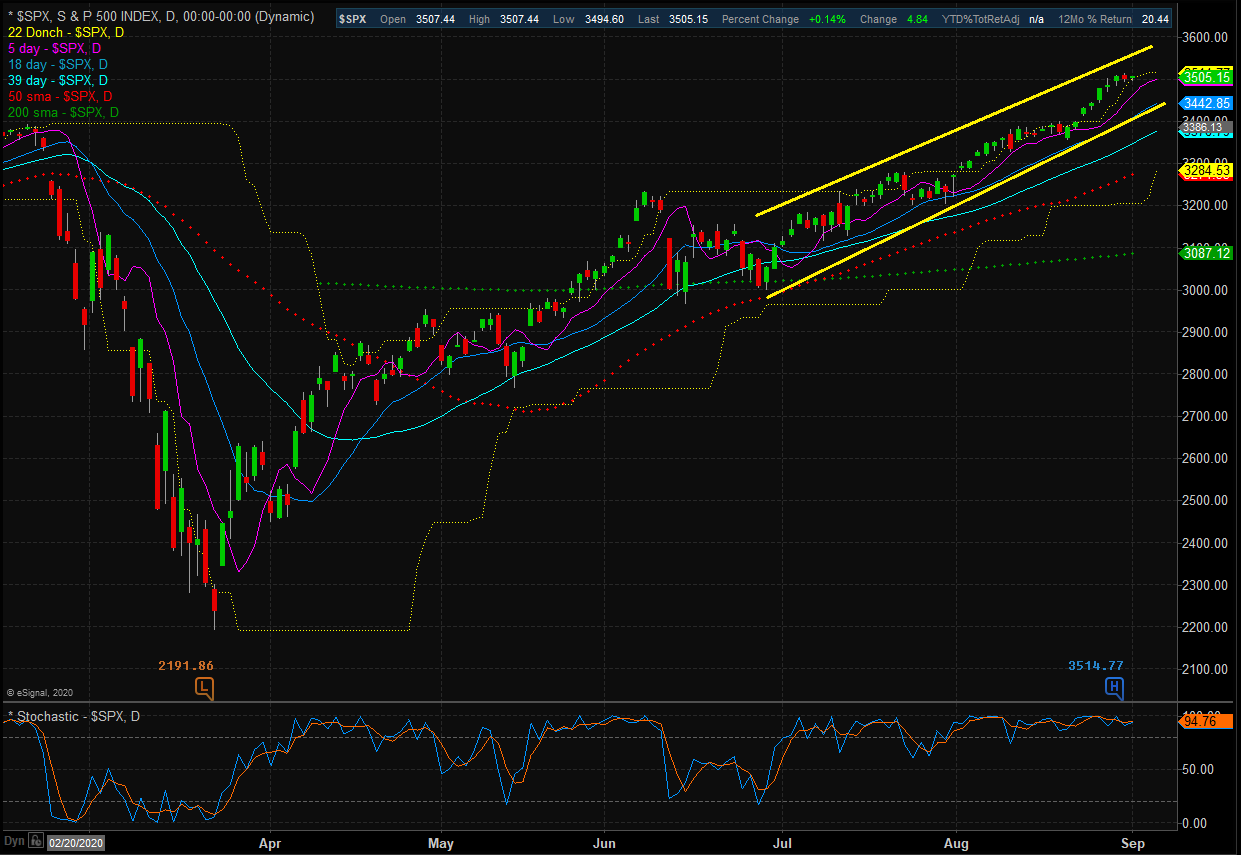
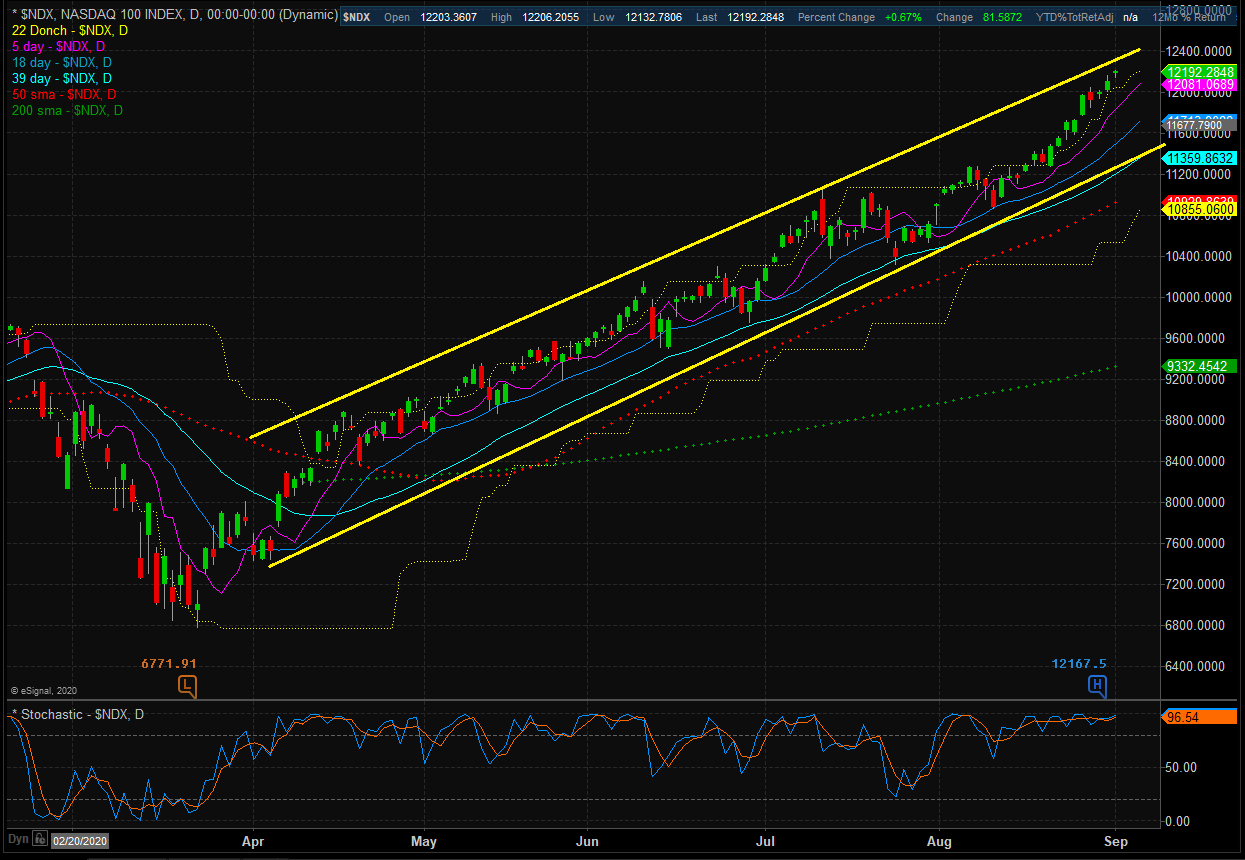
Once again, this remains a tale of two markets. There are those companies that can produce growth, which are represented well in the S&P 500 index and dominate the Nasdaq 100, and those that can't – which tend to make up a large swath of the small- and mid-cap indices. So, if you own the SPY (NYSE:SPY) or QQQ (NASDAQ:QQQ), you are loving life right now. But if you have concentrations in the small-cap, mid-cap, value, and developed foreign countries, well, not so much.
S&P 500 – Daily
NASDAQ 100 - Daily
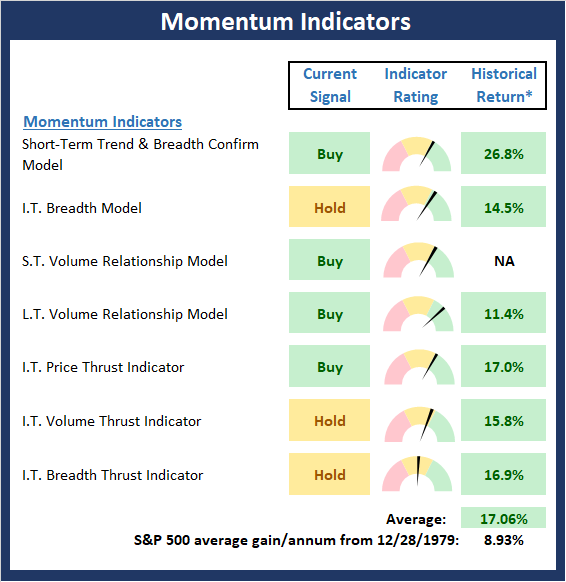
Next, let's check in on the state of the market's internal momentum indicators.

* Source: Ned Davis Research (NDR) as of the date of publication. Historical returns are hypothetical average annual performances calculated by NDR. Past performances do not guarantee future results or profitability.
There is one change to note on the Momentum Board as the Intermediate-Term Breadth Thrust indicator moved from negative to neutral. While the board is far from perfect, I believe it is worth recognizing that the divergences seen in some of the trend and momentum indicators are a result of the COVID environment. As such, I don't view them as negatively as I would under more "normal" circumstances.
Thought For The Day:
'We cannot become what we need to be by remaining what we are.'
-Max De Pree
