Markets continue to be engaged in a very subtle battle for control. Having just witnessed another minor pullback of 5% or so here in May one can certainly argue it’s business as usual in 2021. New highs every month, some smaller pullbacks in between and then off to new highs. Basically the 2013 script.
The latest pullback however came at a point of a critical pivot: The 2020 trend. Would it be saved again, or would there be technical damage inflicted that could foretell a long overdue correction to come following the largest rally of our time?
For context I highlighted the critical junctures of this battle in a video last week:
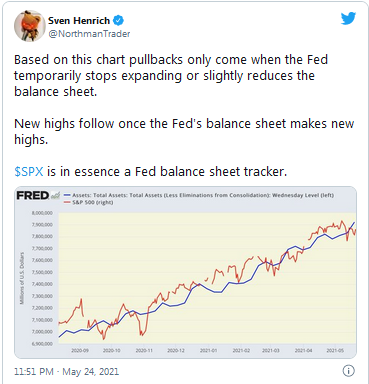
What happened last week? Markets again bottomed and engaged in another furious multiple up gap driven rally coinciding with the Fed expanding its balance sheet by a whopping $92B during the same week:
So yes, business as usual and if this program retains its control new highs should be expected once again.
Indeed, yesterday SPX was again trading within 1% of all time highs. Some correction
Further supporting the notion of new highs coming yet again is one signal chart, that of NYSE, which sees the slow stochastic nearly max oversold, which is ironic considering the market only had a 5% pullback:
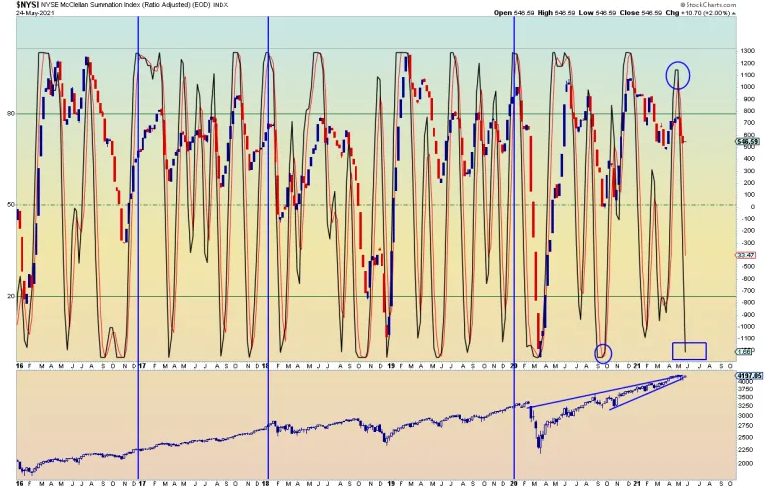
The most oversold reading of its kind in 2021.
In context of the quarterly chart such an oversold reading seems utterly laughable:
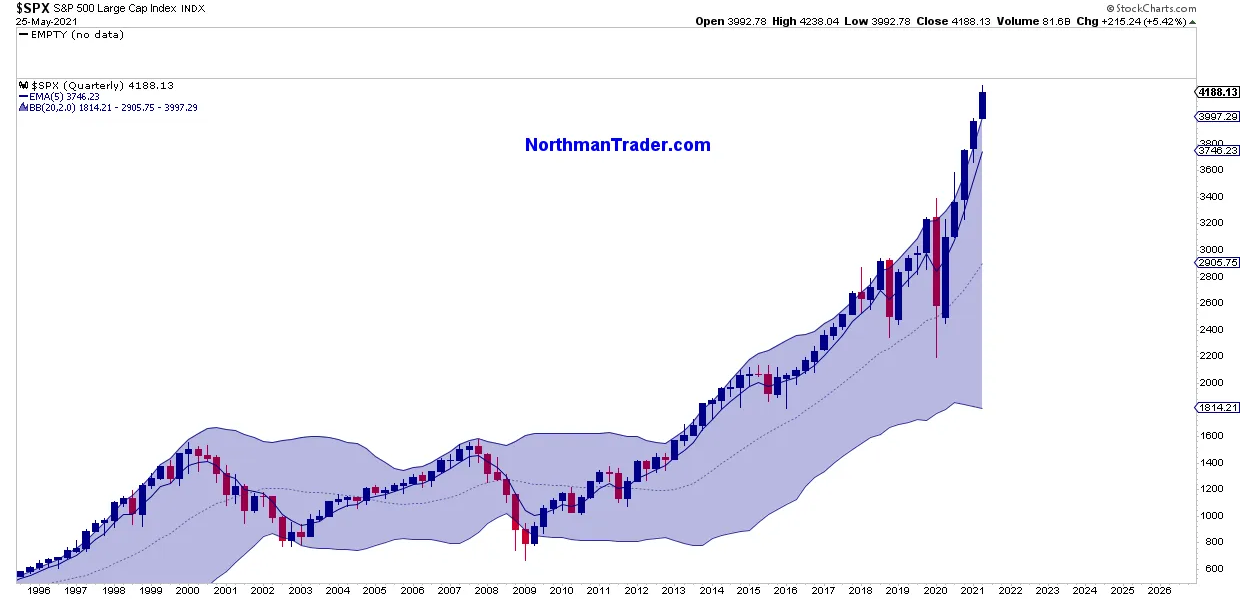
The historical track record for SPX trading entirely outside its upper quarterly Bollinger band is extremely scant.
One example I found was in 1997:
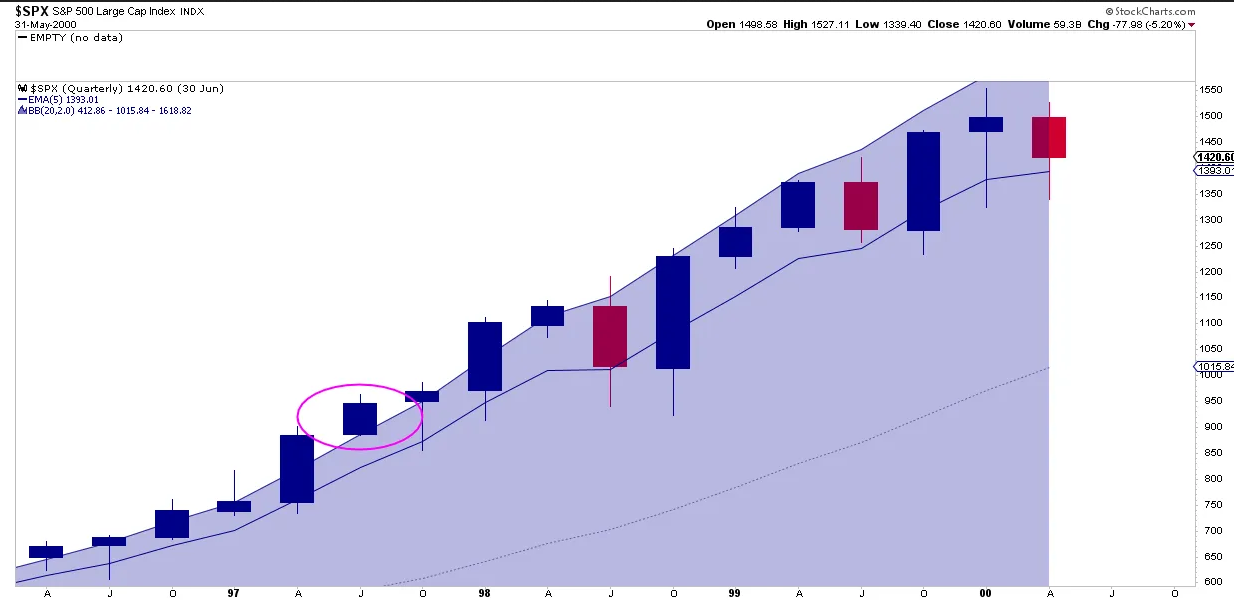
That example resulted in a quarterly 5 EMA reconnect the following quarter. Note in today’s market environment the quarterly 5EMA has not been touched this year yet and is currently sitting at 3746.
Another example of extreme disconnect above the quarterly Bollinger band was just before the 1987 crash:
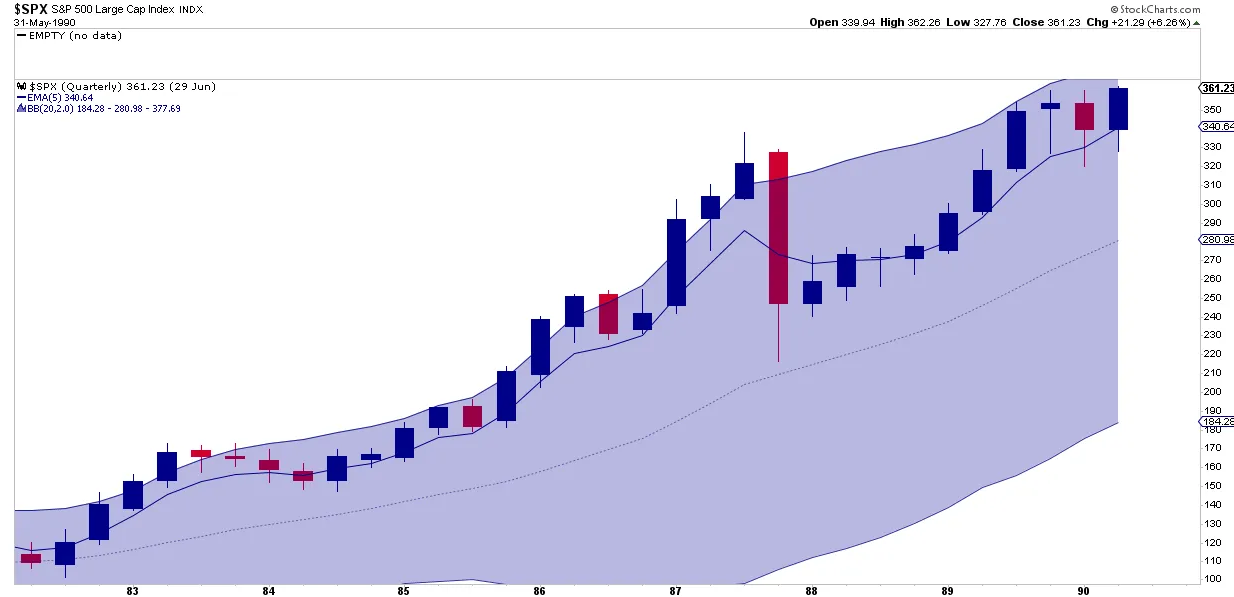
That year too saw 2 quarterly 5 EMA disconnects in the first half of the year only for the crash to offer a rebalancing of extended prices.
The only other example I found was in the 1950s:
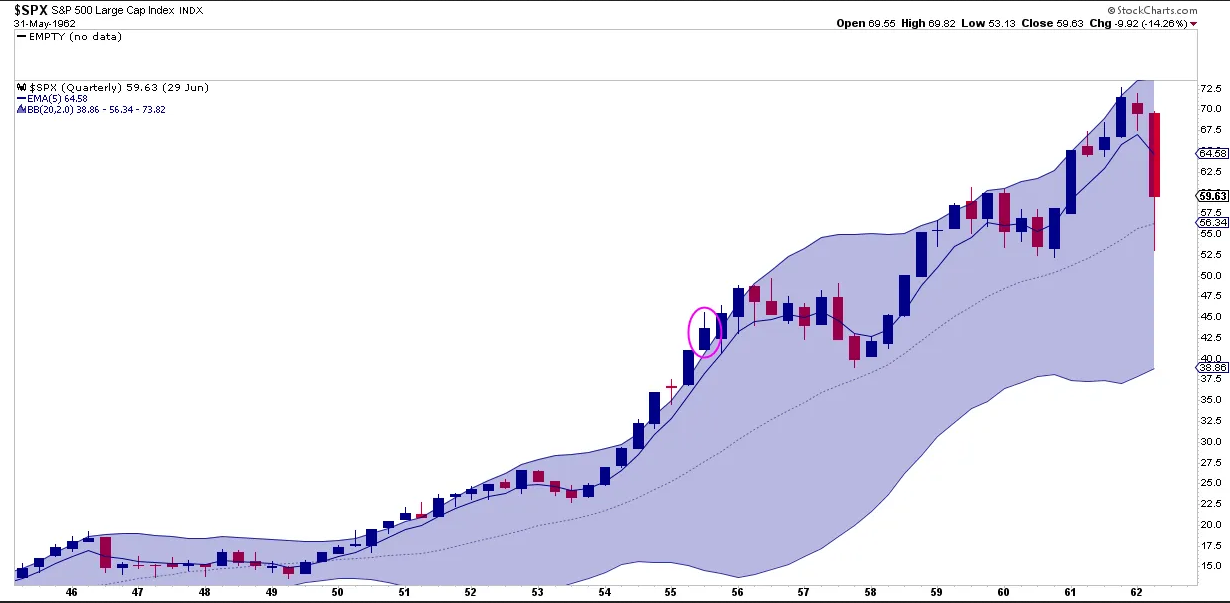
That extension example also produced a quarterly 5 EMA reconnect the following quarter.
Bottomline here: All history suggests a reconnect coming and continuing to chase new highs in context of price entirely above the quarterly Bollinger band is risky in context of all history.
Yet, a Fed continuing to insist on running QE at twice the size of the annual US military budget may indeed continue to suspend history as markets apparently are content to simply track the Fed’s balance sheet.
Still there is something else to consider in context of the recent trend challenge. It’s all very subtle and as of yet unproven, but nevertheless one could make the following case: That the trend actually did break last week and recent strength simply constitutes a back test of the trend:
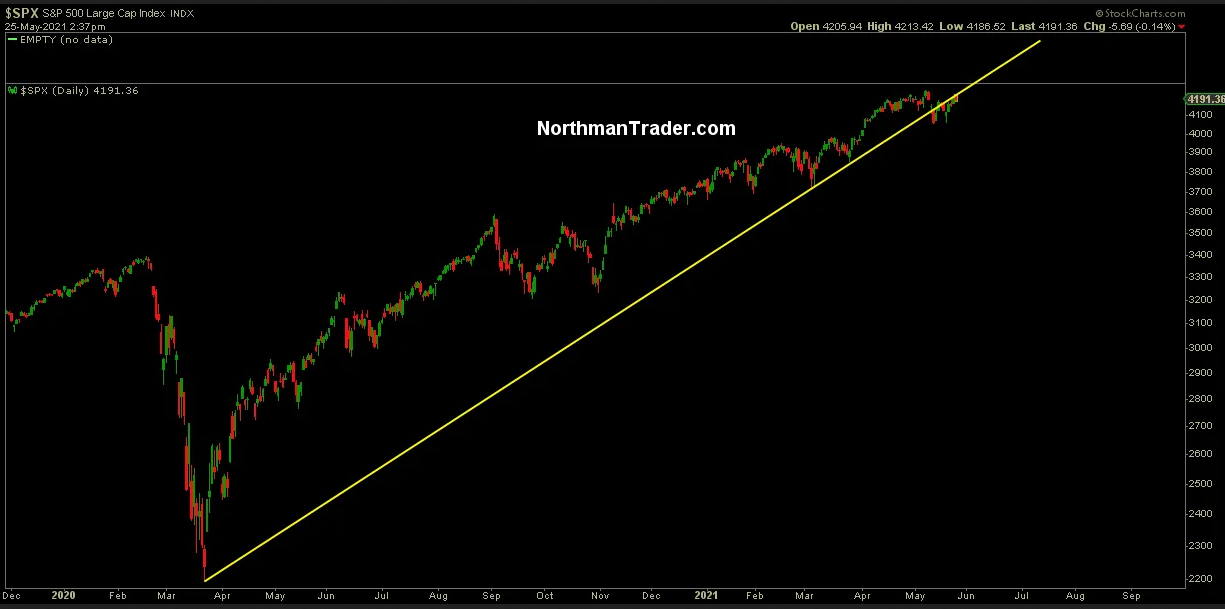
A stretch to make that case you say? Perhaps as there is no evidence of rejection still.
Yet, let me offer two recent examples of similar behavior.
The first example is NDX in 2018:
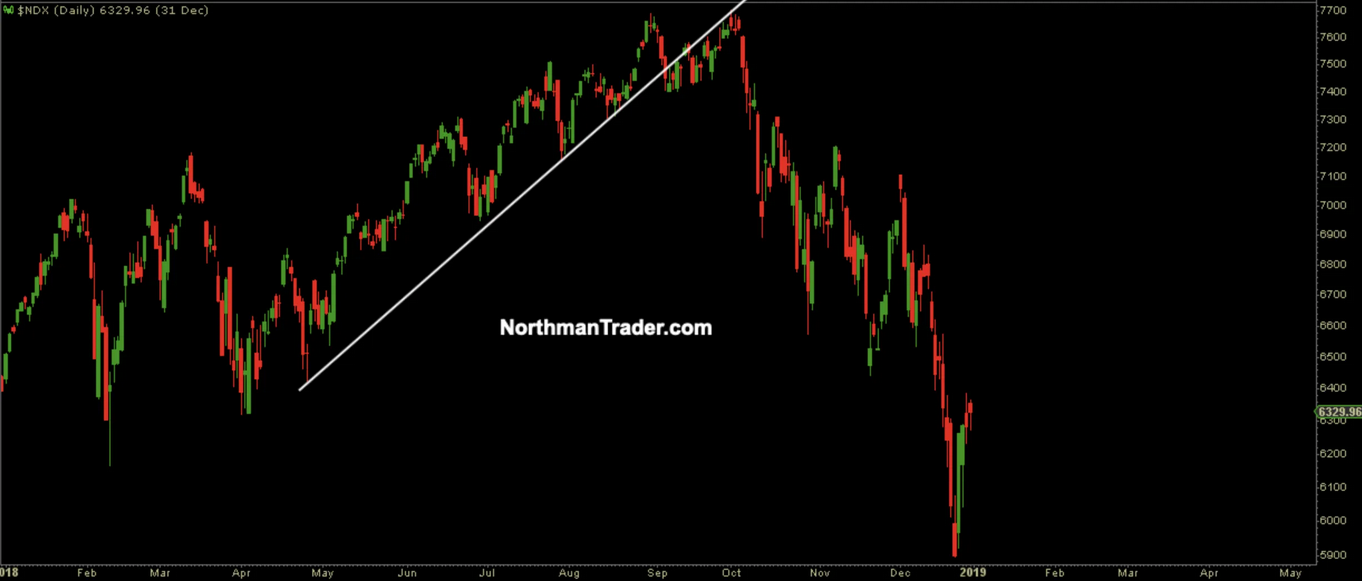
An uptrend that broke with little initial follow through. Indeed what we witnessed was a period of 15 days hugging and back testing the broken trend line before markets then rolled over in earnest an ended in a 20% correction on SPX.
The second example is February 2020:
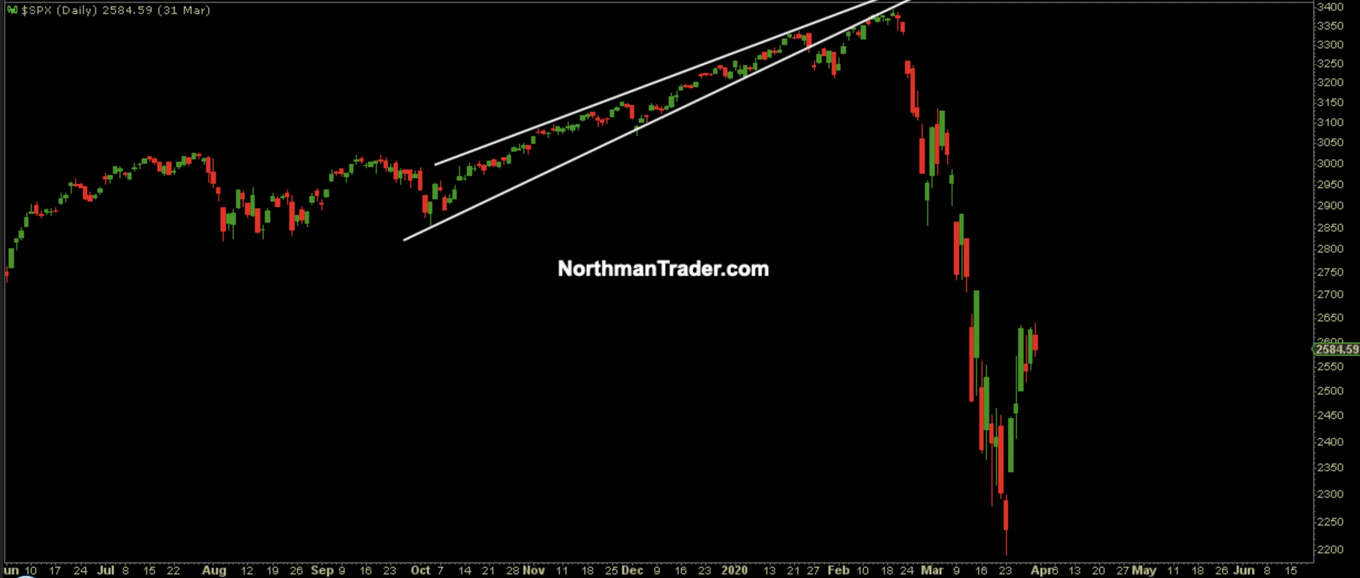
Here too we witnessed a relentless uptrend in tight price ranges, then a trend break in January 2020 that was initially ignored and followed by a series of back tests of the broken trend line.
Both in 2018 and 2020 these charts produced marginal new highs giving the appearance of business as usual when they instead turned out to be a major selling opportunities.
Also of note: The final rallies tagging the broken trend lines were marked by low volume and steady ascents and tight price ranges. Basically exactly what we are seeing currently. None of this proves a repeat is imminent, but it suggests the possibility exists. Based on the 2018 and 2020 examples this chugging along the broken trend line could last anywhere from 10-15 days. If there is to a repeat this leaves room for marginal new highs still first and the process to continue into early June or a rejection could of course occur at any time.
When will we know if these structures apply? Once there is a confirmed rejection below last week’s lows for the trend break would be validated then.
The target if it were to come to fruition? Frankly lots of possibilities. From a basic monthly 5 EMA reconnect, to a daily 100MA-200MA reconnect and even a quarterly 5 EMA reconnect.
For reference: The monthly 5 EMA is at 3987 at the moment, the daily 100MA is currently at 3972 offering confluence support, the 200MA at 3731, the quarterly 5EMA at 3746 also offering confluence support. Both zones could set up for long bounce rallies. In 2013 a reconnect to the 100MA in June of that year was the extent of major corrective activity in that year.
If the Fed remains in full control I suppose there is nothing to worry about, if these 2018 and 2020 chart patterns now seemingly repeated in 2021 have any relevance then current market strength and/or any potential marginal new highs may turn out to be a major bull trap. We’ll know more in the next week or two.

