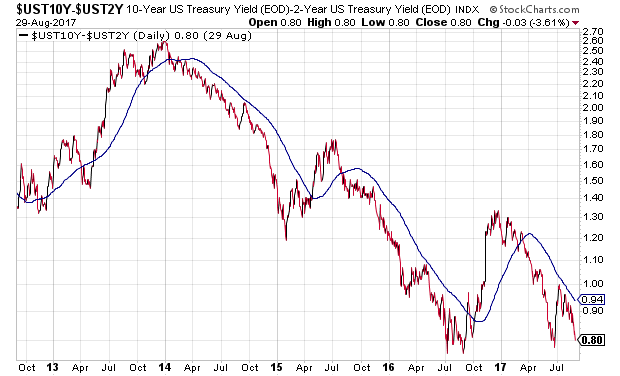
In the current business cycle, the Treasury bond yield curve has rarely been flatter. The spread between 30s and 2s is a paltry 1.4% and the spread between 10s and 2s is a meager 0.8%.
Historically, the yield curve has been close to flawless as an expansion-contraction indicator. When a flattening curve dipped below ‘zero,’ the inversion foreshadowed seven out of the last 8 recessions.
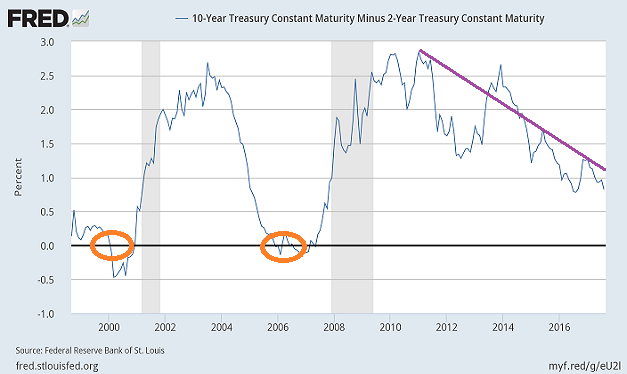
However, the Federal Reserve’s creation of trillions in electronic dollar credits (a.k.a. “quantitative easing” or “QE”) alongside lengthy near-zero rate policy altered the predictive capability of the yield curve. For instance, the Fed has more recently bumped overnight lending rates up to 1%-1.25% on the shortest end. Yet economic and geopolitical uncertainty have been pressuring longer-term yields and sending them downward. Still, with shorter-term rates so low from the get-go, there may not be a hallowed moment when the spread between 10s and 2s hit 0% and subsequently usher in a recessionary environment.
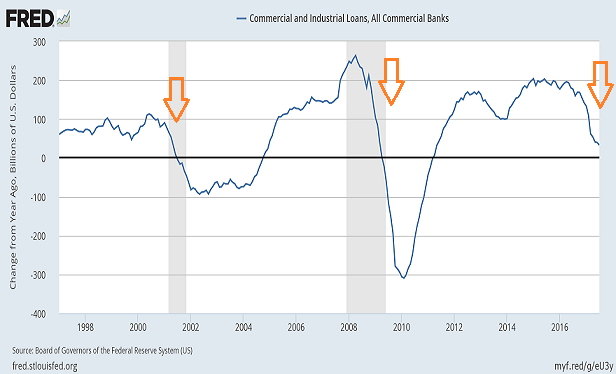
On the flip side, few would declare that the flattening of the yield curve is signaling strength. It hurts bank profitability. Worse, it inhibits their willingness to lend. Business loans have been sinking in dramatic fashion.
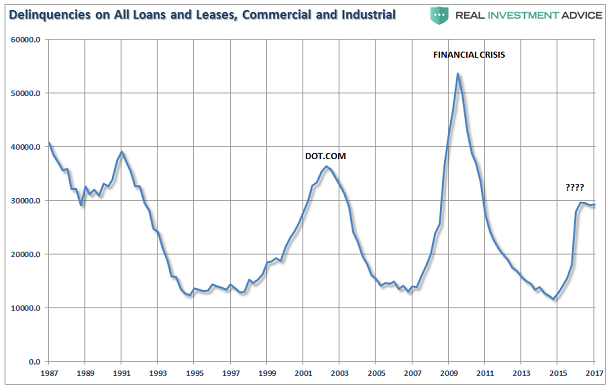
Granted, a great deal of trouble may be concentrated in the beleaguered retail and energy sectors. Nevertheless, it certainly cannot be helpful that delinquencies are climbing.
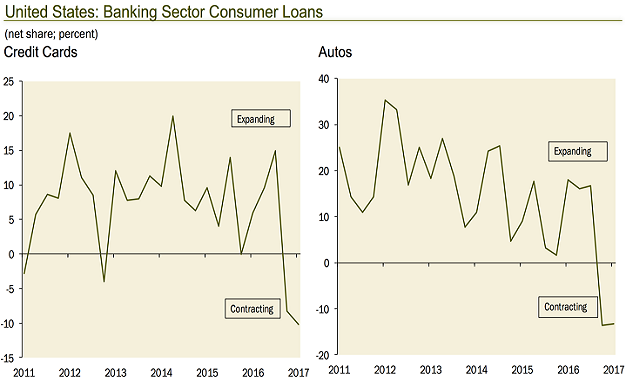
If commercial and industrial loans (C&I) are stalling, perhaps the ‘confident’ consumer is picking up the slack. Not really. Credit cards and auto loans have been declining as well.
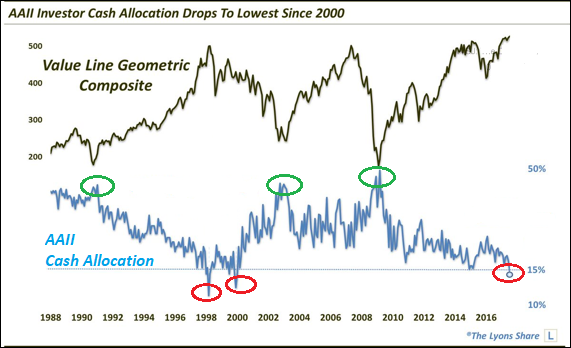
Keep in mind, the central bank of the United States (a.k.a. “the Fed”) has not been genuinely concerned with its dual mandate of full employment and stable inflation. Since 2009, monetary policy leaders have been hell-bent on getting the investment community to remove their dollars from cash accounts and place them in assets like stocks, bonds and real estate. Prices on most market-based assets continue to hover near all-time highs with no regard for traditional valuation or credit cycle deterioration.
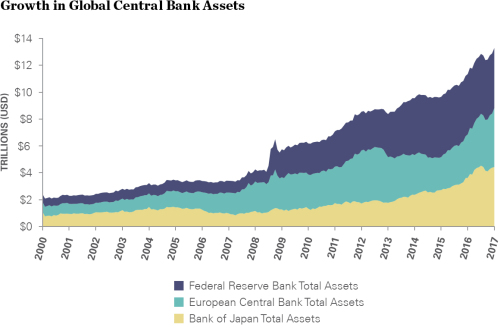
So now comes the biggest challenge of them all. If the Fed does not continue on its path of pushing overnight lending rates higher or fails to reduce its balance sheet, it risks having negligible firepower to fend off inevitable economic contraction in a future year. If the Fed goes too far? If it removes too much of the stimulus that has propped up asset prices so successfully? Then the wealth effect could reverse in violent fashion.
Indeed, global QE has had an enormously positive influence on asset prices. However, if trillions in global QE are scaled back, is it an unreasonable assumption to anticipate a negative influence on overleveraged, overvalued assets? If the Fed is serious about normalizing its balance sheet by letting bonds mature without reinvesting the proceeds and/or selling the debt obligations on its books, would a downward sloping trend in global central bank balance sheets correspond to a downtrend for equities?
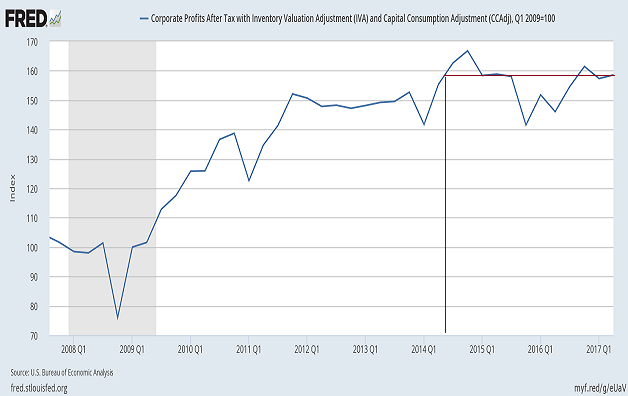
Not only is the credit cycle slowing at a time when then the Fed is adamant that it will begin tapering balance sheet holdings, but the notion that corporate earnings will serve as a tailwind for stocks is also flawed. Consider Strategas Research Partners’ commentary that earnings growth has nowhere to go but down. Their contention? Year-over-year growth that is being compared to the earnings recession of 2016 artificially elevates the Q1 and Q2 percentages for 2017. Consequently, earnings growth will weaken in Q3 and Q4, before weakening even further at the start of 2018.
In truth, corporate profits do not look much better than they did three years ago. Investors are simply paying a higher price for lower prospective returns in the future.
Then again, profits have not mattered as much to bull market success on this go-around as has participation in ETF indexing. Amazon’s (NASDAQ:AMZN) dearth of profits on virtually any measure of profitability hammers home that reality. In fact, the online superstore logged a 77 percent drop in quarterly income in its most recent quarterly report. It did not matter. Passive inflows into S&P 500 index fund vehicles disproportionately favor mega-caps like Amazon, Johnson & Johnson (NYSE:JNJ) and Exxon Mobil (NYSE:XOM), even as their profits stagnate.
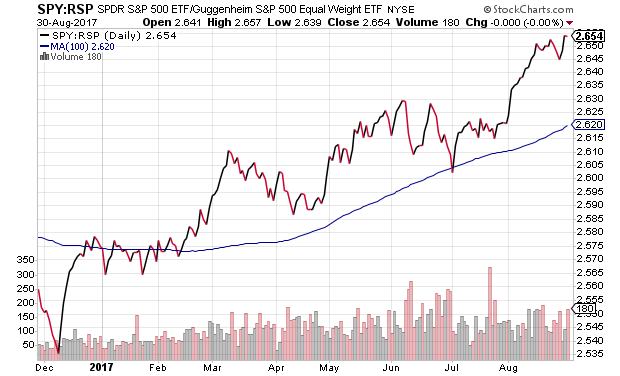
Many would argue that the bull market’s continuation rests on the shoulders of tax reform. However, Guggenheim’s S&P 500 Equal Weight ETF (NYSE:RSP) has sharply underperformed the S&P 500 SPDR (NYSE:SPY) since the Trump rally hit its enthusiastic pinnacle in December. Ever since, global QE injections ($1.8 trillion-plus) have been primarily responsible for the rise in domestic market equities, foreign developed market equities as well as emerging market equities.
If global QE tapering actually comes to fruition, substantial corporate tax cuts would become the “show-me” stimulus. Right now, however, stocks are not buying the tax cut legislation angle. The SPY:RSP price ratio continues to rise; companies most likely to benefit from tax reform (i.e. smaller-caps) are seeing less meaningful price appreciation.
Disclosure Statement: ETF Expert is a web log (“blog”) that makes the world of ETFs easier to understand. Gary Gordon, MS, CFP is the president of Pacific Park Financial, Inc., a Registered Investment Adviser with the SEC. Gary Gordon, Pacific Park Financial, Inc., and/or its clients may hold positions in the ETFs, mutual funds, and/or any investment asset mentioned above. The commentary does not constitute individualized investment advice. The opinions offered herein are not personalized recommendations to buy, sell or hold securities. At times, issuers of exchange-traded products compensate Pacific Park Financial, Inc. or its subsidiaries for advertising at the ETF Expert website. ETF Expert content is created independently of any advertising relationship.
