Weekly Trend Model signal
Trend Model signal: Risk-on
Direction of last change: Positive (for an explanation, see An intriguing Trend Model interim report card).
Looking for leadership in the current bull cycle
It is a truism among technical analysts that each bull market is characterized but different kinds of market leaders. After the bull peaks, the old market leaders fade and new leaders take the baton.
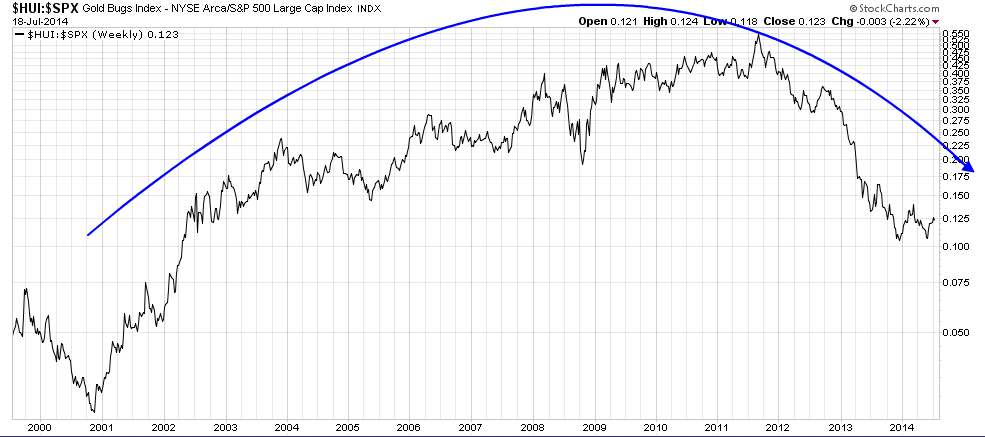
As examples, the bull phase of the late 1970's was marked by hard-asset, inflation-hedge leadership such as Energy and Materials. As a reminder of how difficult it is for former leaders to recover, the poster child of inflation-hedge vehicles, gold, peaked out at $850 in early 1980 and went into a long bear phase that did not bottom out until 2001.
The next bull cycle was characterized by consumer stocks, first Consumer Staples and the enthusiasm spread into Consumer Discretionary companies. The shares of these companies were driven by the LBO-boom, fueled by junk bond offerings. (Recall Robert Campeau and his junk-bond fueled takeovers of Federated and Allied Department Stores and how it all came crashing down on him.)
The bull market of the 1990's was the TMT era - Tech, Media and Telecom. The Four Horsemen (Intel (NASDAQ:INTC), Cisco (NASDAQ:CSCO), Sun Microsystems [acquired by Oracle in 2010] and Oracle (NYSE:ORCL)) boomed and it all ended with the NASDAQ peak in March 2000.
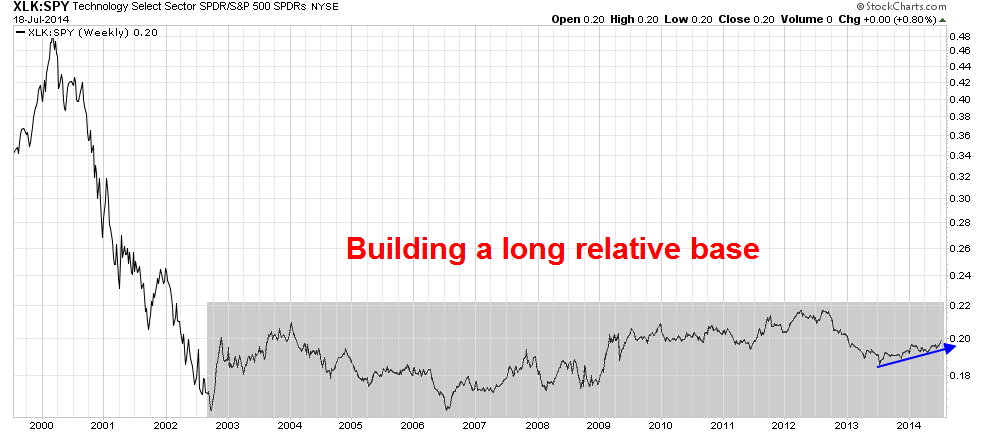
The lesson for investors is, "Once a bull market ends, don't cling to the leadership over the previous bull cycle. Look for new leadership." As an illustration of this principle, consider this 15-year chart of the relative performance of Technology stocks (via the SPDR Select Sector - Technology ETF (NYSE:XLK)) relative to the SPX. The sector peaked out with the NASDAQ in early 2000, tanked and has been in a sideways relative consolidation phase for over a decade.
While the relative uptrend (shown by the blue arrowed trend line) shows some promise, this sector is unlikely to be the next market leader for some time. Telecom stocks (not shown) also display a similar pattern of rise, fall and sideways relative consolidation.
Previous leaders falter
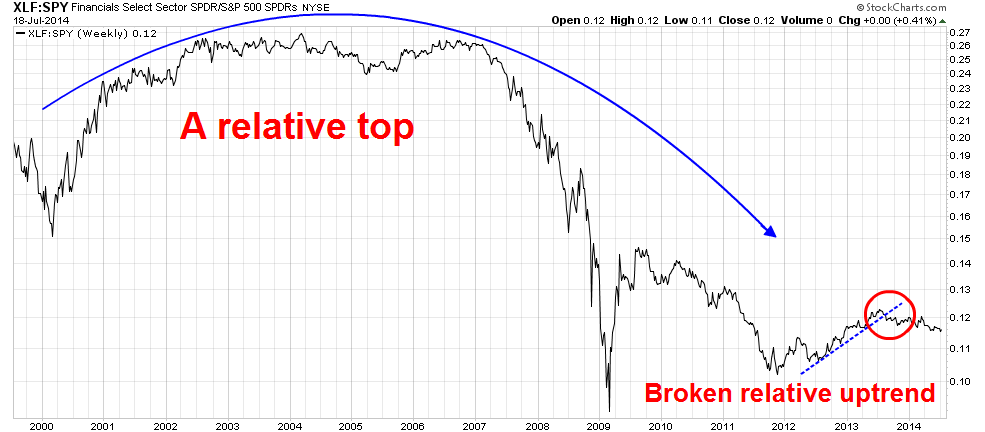
So what are the leaders in this bull cycle? I would not look for them among the last bull cycle's leaders. Here is the relative performance chart (all 15-year time frames) of Financials (via the Financial Select Sector SPDR Fund (ARCA:XLF)) against the market. The relative performance pattern of this sector looks like the Tech sector, but pulled forward by a few years. Financials appear to be undergoing a sideways relative consolidation pattern.
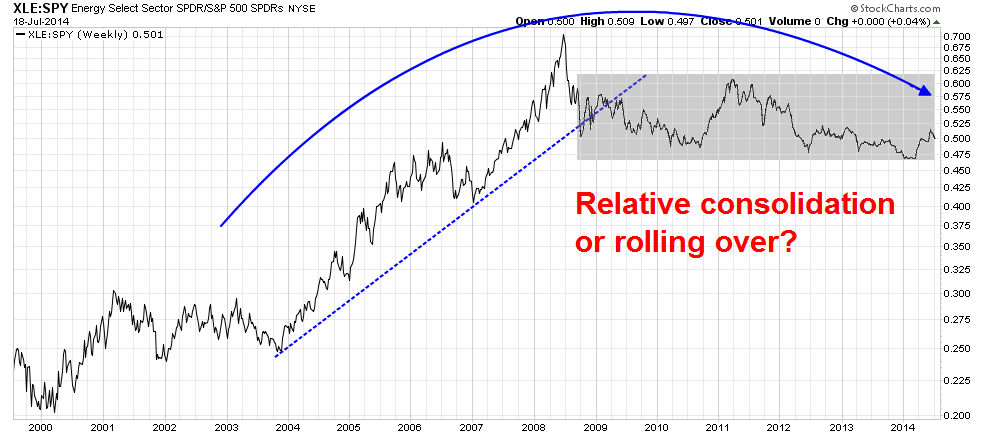
The bull market of the early 2000s was marked by the revival of hard-asset plays. Here is the relative performance chart of the Energy sector (SPDR Energy Select Sector Fund (ARCA:XLE)). While Energy did not crash as the Financials did in the aftermath of the Lehman Crisis, this sector is either making a broad relative top by rolling over or, more charitably characterized as undergoing a sideways relative consolidation. No leadership here.
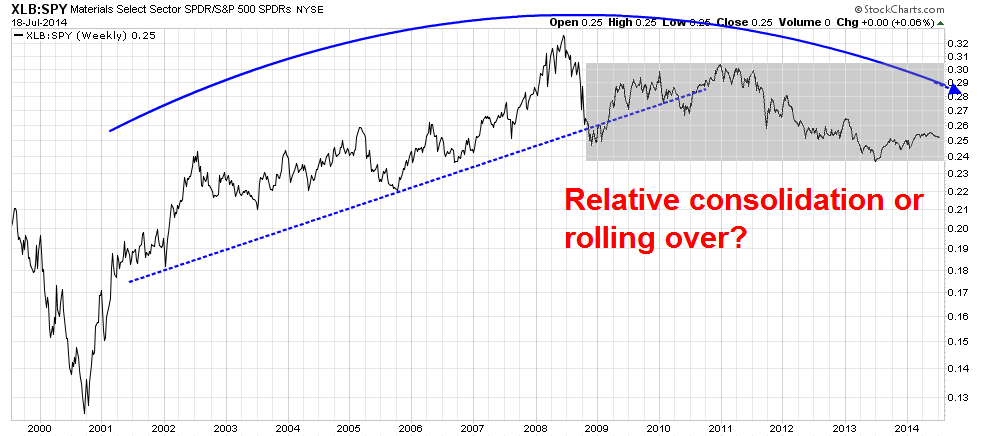
The relative performance of the other hard-asset sector, Materials (SPDR Materials Select Sector (ARCA:XLB)), shows a similar pattern of either relative rollver or sideways consolidation.
Looking for the new leaders
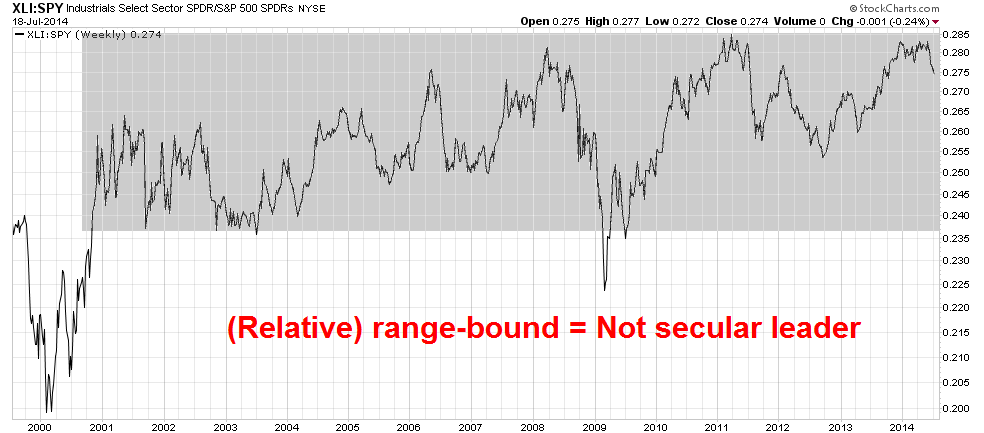
Once we have ruled out past leaders, we then look for the new leadership among other candidates. The cyclically sensitive Industrial stocks (ARCA:XLI) don't appear to be the new leaders, as they remain in a broad sideways relative range against the SPX.
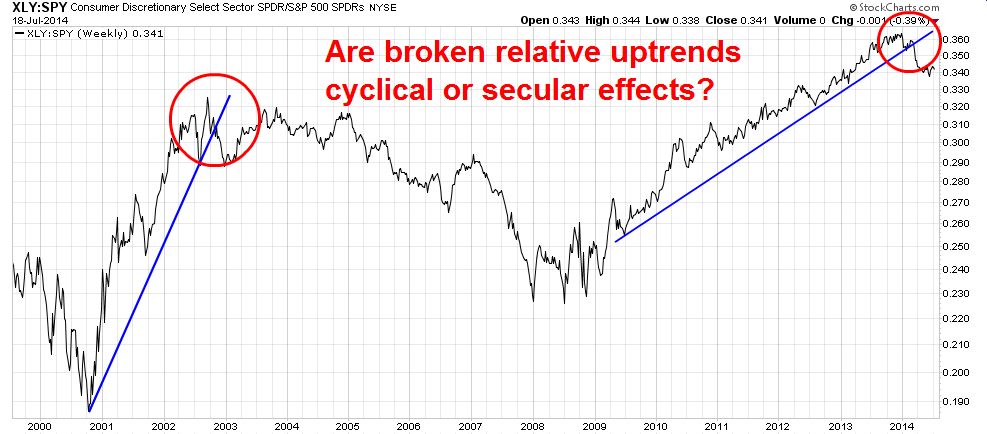
A case could be made for the Consumer Discretionary sector (SPDR Consumer Discretionary Select Sector Fund (ARCA:XLY)), but the knock against these stocks is 1) relative outperformance in the past couple of episodes appears to be cyclical and not secular in nature; and 2) these stocks are starting to falter as they recently breached a relative uptrend. If we accept the premise that Consumer Discretionary stocks constituted this cycle's secular leadership, then the conclusion is this bull market is over. Kaput!
The healthcare surprise
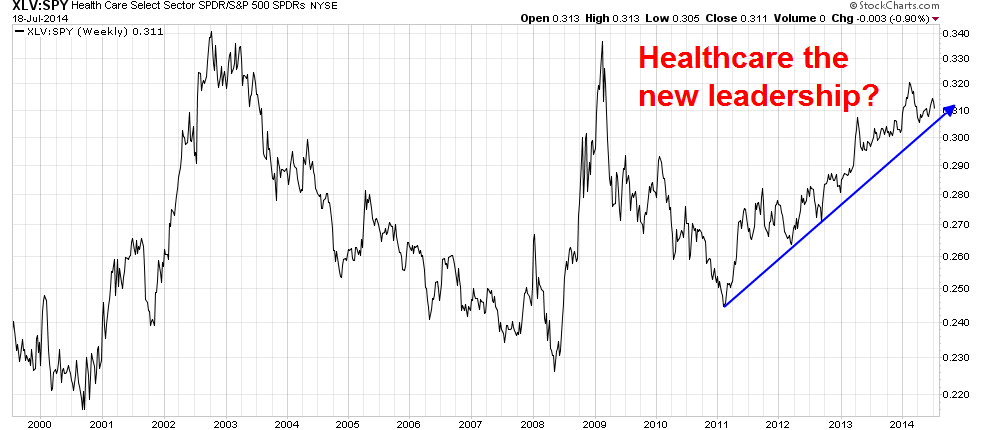
There are only 10 GICS sectors and the sectors that are left are thought to be defensive in nature: Utilities, Consumer Staples and Healthcare. Relative performance charts of the first two, Utilities and Consumer Staples, do not reveal them to be the market leaders. This bull market`s leadership appears to be—surprise—healthcare (SPDR - Health Care Fund (ARCA:XLV)).
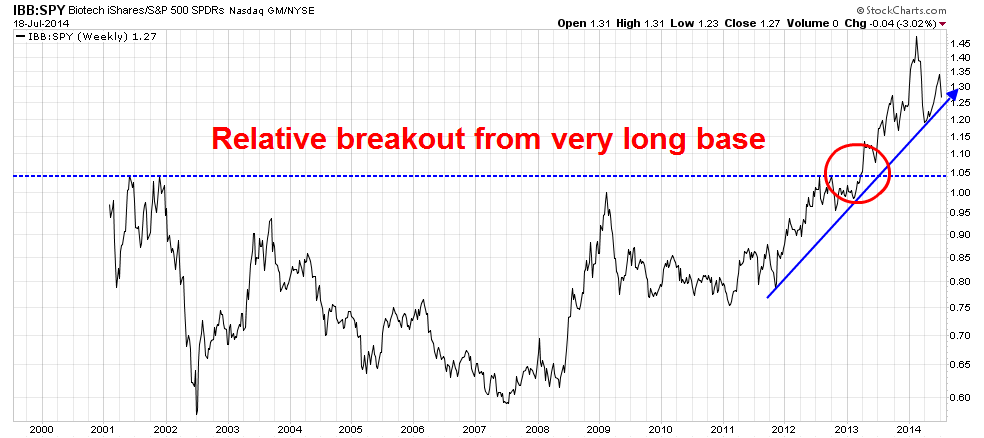
From a technical point of view, the Biotech stocks appear to be just getting started. The relative performance chart of iShares Nasdaq Biotech (NASDAQ:IBB) against SPY shows that IBB only just staged a relative breakout out of a long base lasting over a decade. That's a formula for much more relative gains.
"Dr. Yellen — Thank you for sharing your thoughts recently on the biotech sector. … You stated that biotechnology valuations are 'stretched, with ratios of prices to forward earnings remaining high relative to historical norms.'"
As evidence, Schoenbaum included Russell 1000 data from biotech stocks dating back to 1978, "and my data show that the current ratio is roughly in line with the historical median and is approximately 40% below the peak.
"Please tell me what I'm missing, Dr. Yellen," he wrote.
Schoenbaum added that he had a "great deal of respect" for Yellen.
"However, we have a different view, perhaps, of the data on price-to-earnings ratios," he said.
Schoenbaum called biotech is "a large, large sector" with hundreds of companies, "most of which have no profits and no earnings. They're basically options vehicles based on a drug that will report data out in a few months. And certainly, in 2012 and 2013, it was an unprecedented bull run in biotech. For some of those stocks, there's probably too much optimism baked in.
"But of course, in the giant universe of biotech stocks, you're going to find stocks that are overvalued and you're going to find some that are undervalued."
More room for this bull to run
Since market leadership generally changes when a bull market ends, the longevity of the run in Healthcare and Biotech is a function of the health of the current bull run. Despite my concerns about valuation (see More evidence of a low return equity environment), I believe that this bull market is long from over. Even Jeremy Grantham, who has been known as a value investor, is postulating a M+A driven market bubble for the stock market:
These are my reasons. First, when compared to other deal frenzies, the real cost of debt this cycle is lower. Second, profit margins are, despite the first quarter, still at very high levels and are widely expected to stay there. Not a bad combination for a deal maker, but it is the third reason that influences my thinking most: the economy, despite its being in year six of an economic recovery, still looks in many ways like quite a young economy. There are massive reserves of labor in the official unemployment plus room for perhaps a 2% increase in labor participation rates as discouraged workers potentially get drawn into the workforce by steady growth in the economy. There is also lots of room for a pick-up in capital spending that has been uniquely low in this recovery, and I use the word “uniquely” in its old-fashioned sense, for such a slow recovery in capital spending has never, ever occurred before. The very disappointment in the rate of recovery thus becomes a virtue for deal making.
Previous upswings in deals tended to occur at market peaks, like 2000 and 2007, which in complete contrast to today were old economic cycles already showing their wrinkles. Worse than being in full swing, they were usually way over capacity. Thus, 2000 was helped along by the bubble in growth stocks to over 60 times earnings, allowing companies like Cisco, possibly correctly, to believe they were dealing with a near-zero cost of capital in making deal after deal for their massively overpriced stock.
Bull markets end in one of two ways, recession or a correction from excess valuation (1987, 2000 for NASDAQ). There are few signs of a US recession in the near future. Grantham wrote that the US economy "looks in many ways like quite a young economy" with more expansion potential in the future. As well, the latest review of high-frequency economic indicator from New Deal Democrat is also pointing to continued strength.
While valuations appear somewhat stretched, any market downturn needs a trigger. I have expressed some concerns about the possibility of an EPS growth scare. However, the early indications from Bespoke show that EPS and revenue beat rates this earnings seasons are at or above historical norms.
If Healthcare and Biotech are indeed the new leaders of this market cycle, then we need more excesses to build before this bull run is over. One sign is the sector weighting of Healthcare. Bespoke reports that Healthcare only represents the third highest weight in the S&P 500. Before the bubble pops, we need to see this sector get to at least the second largest weighting, or perhaps the top weighted sector in the S&P 500.
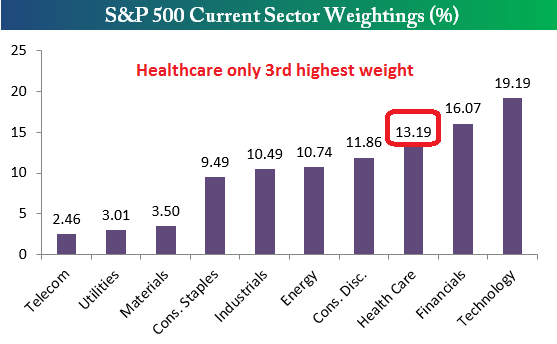
Given the technical picture of the relative upside breakout of Biotech stocks and the sector weighting position of Healthcare, these stocks may have a lot further to run.
Disclosure: Cam Hui is a portfolio manager at Qwest Investment Fund Management Ltd. ("Qwest"). This article is prepared by Mr. Hui as an outside business activity. As such, Qwest does not review or approve materials presented herein. The opinions and any recommendations expressed in this blog are those of the author and do not reflect the opinions or recommendations of Qwest.
None of the information or opinions expressed in this blog constitutes a solicitation for the purchase or sale of any security or other instrument. Nothing in this article constitutes investment advice and any recommendations that may be contained herein have not been based upon a consideration of the investment objectives, financial situation or particular needs of any specific recipient. Any purchase or sale activity in any securities or other instrument should be based upon your own analysis and conclusions. Past performance is not indicative of future results. Either Qwest or Mr. Hui may hold or control long or short positions in the securities or instruments mentioned.
