Russell 2000 Breaking Higher

Published 12/30/2014, 10:07 AM
Updated 07/09/2023, 06:31 AM

Those words have not been heard in over 14 months. While the S&P 500 has made something like 800 new all-time highs and the Nasdaq 100 keeps marching towards the 2000 top, the Russell 2000 has been in a range since October 2013. The only brief moment out of that range was a false breakdown in October that got the entire investment world convinced that a 2009 like breakdown was imminent.

What a crazy view of sentiment. The Russell 2000 holds in a range near all-time highs with only a minor breakdown to the 100 week SMA, and you want to sell everything. Think the memory of the Financial Crisis has faded?
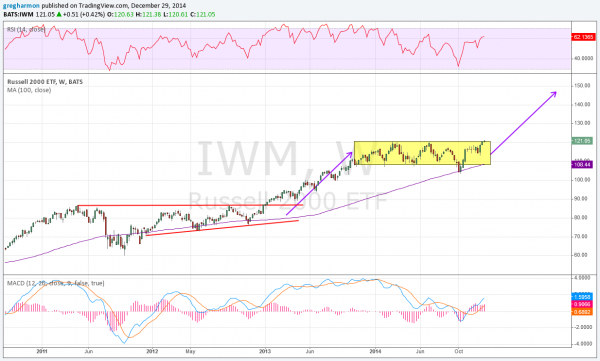
Russell 2000 ETF (IWM) Chart  From January 2011-To Present

But now, the Russell 2000 is breaking to the upside. It was a concern when the Russell 2000 was not rising, because it had led all equities higher for so long. So when it lagged the world was ending.

Now that we have seen the S&P 500 and Nasdaq 100 continue to rise over the time period when the Russell did nothing, what will happen if the Russell continues higher? Time to go all in? Finally time to sell Bonds?

Prices will tell over time, but a continuation higher in the Russell 2000 now out of a long base is very bullish. Using the (ARCA:IWM) ETF chart above, it seeks a move to 147, or 21% higher.

Latest comments

Loading next article…
Risk Disclosure: Trading in financial instruments and/or cryptocurrencies involves high risks including the risk of losing some, or all, of your investment amount, and may not be suitable for all investors. Prices of cryptocurrencies are extremely volatile and may be affected by external factors such as financial, regulatory or political events. Trading on margin increases the financial risks.
Before deciding to trade in financial instrument or cryptocurrencies you should be fully informed of the risks and costs associated with trading the financial markets, carefully consider your investment objectives, level of experience, and risk appetite, and seek professional advice where needed.
Fusion Media would like to remind you that the data contained in this website is not necessarily real-time nor accurate. The data and prices on the website are not necessarily provided by any market or exchange, but may be provided by market makers, and so prices may not be accurate and may differ from the actual price at any given market, meaning prices are indicative and not appropriate for trading purposes. Fusion Media and any provider of the data contained in this website will not accept liability for any loss or damage as a result of your trading, or your reliance on the information contained within this website.
It is prohibited to use, store, reproduce, display, modify, transmit or distribute the data contained in this website without the explicit prior written permission of Fusion Media and/or the data provider. All intellectual property rights are reserved by the providers and/or the exchange providing the data contained in this website.
Fusion Media may be compensated by the advertisers that appear on the website, based on your interaction with the advertisements or advertisers.
© 2007-2025 - Fusion Media Limited. All Rights Reserved.