The Red Hot Shanghai Market Might Be Cooling Off

Published 01/12/2015, 08:59 AM
Updated 07/09/2023, 06:31 AM

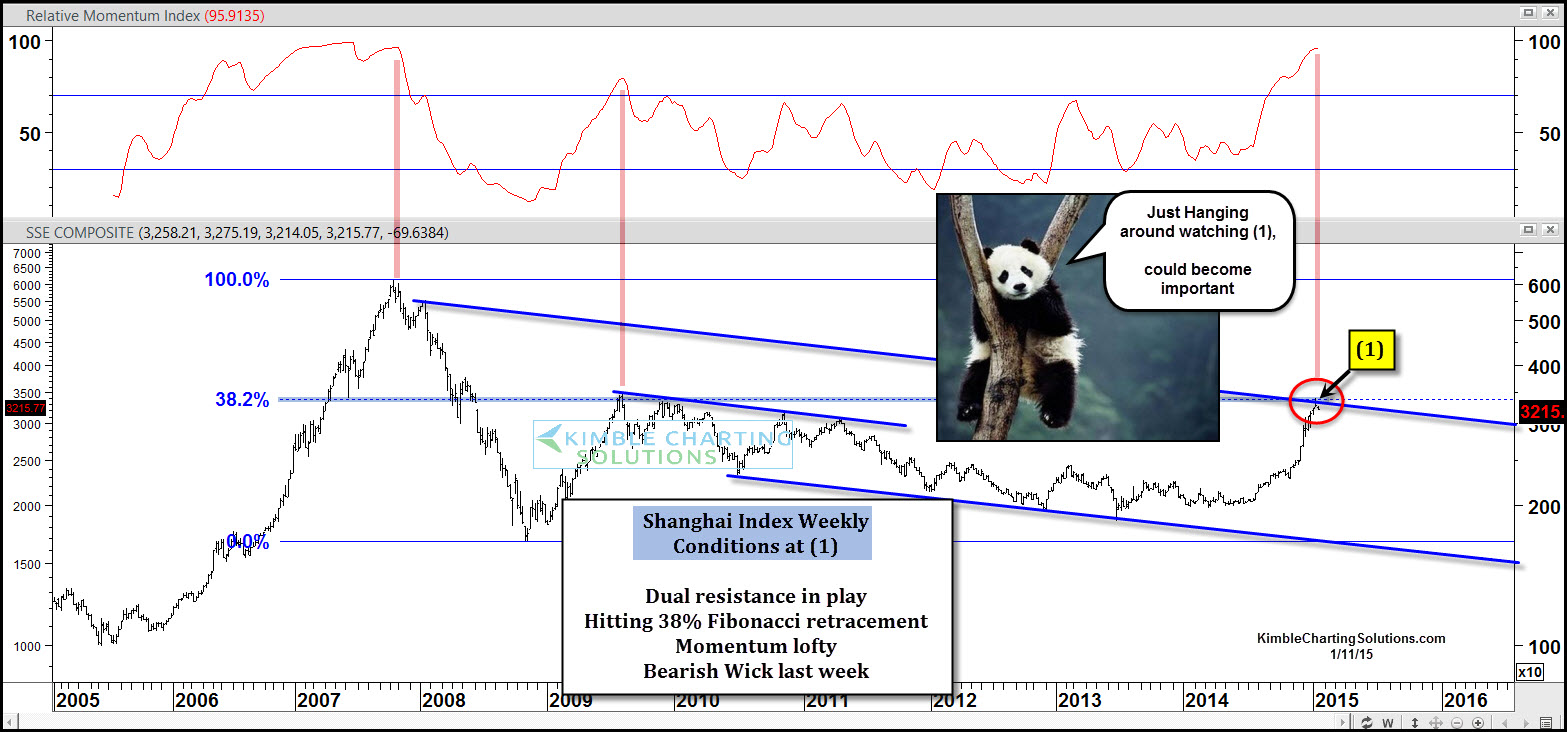
Shangai Index Weekly Chart From 2005-To Present

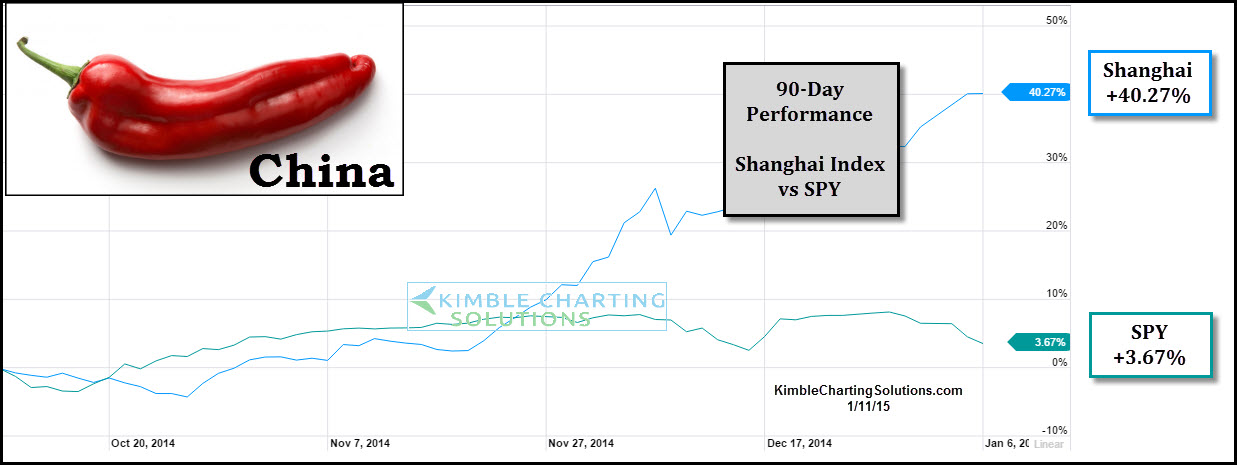
When it comes to "Red Hot" stock markets around the world, the overwhelming winner the past 90-days is the Shanghai Index up more than 40%. Even though the S&P 500 is doing well and is just under 3% away from all-time highs, its performance compared to the Shanghai index over the past 90-days is pretty cool, as it underperformed by -37%. (see chart below)

The red hot performance has now created the following conditions in the chart above...The index is now touching the top of multi-year falling channel, at its 38% Fibonacci retracement level based upon the 2007 highs/2008 lows and it created a bearish wick last week at (1) with momentum at the highest level since 2007.

Shanghai Index vs SPY, 90 day performance

One thing is perfectly clear at this time, the trend is "UP" in the Shanghai index. (Above support and all key long-term moving averages).

I attempt to find price zones where reversals "can" take place (See TB&M Strategy). Time will tell if this will become an important inflection zone for the worlds hottest stock market.

Latest comments

Loading next article…
Risk Disclosure: Trading in financial instruments and/or cryptocurrencies involves high risks including the risk of losing some, or all, of your investment amount, and may not be suitable for all investors. Prices of cryptocurrencies are extremely volatile and may be affected by external factors such as financial, regulatory or political events. Trading on margin increases the financial risks.
Before deciding to trade in financial instrument or cryptocurrencies you should be fully informed of the risks and costs associated with trading the financial markets, carefully consider your investment objectives, level of experience, and risk appetite, and seek professional advice where needed.
Fusion Media would like to remind you that the data contained in this website is not necessarily real-time nor accurate. The data and prices on the website are not necessarily provided by any market or exchange, but may be provided by market makers, and so prices may not be accurate and may differ from the actual price at any given market, meaning prices are indicative and not appropriate for trading purposes. Fusion Media and any provider of the data contained in this website will not accept liability for any loss or damage as a result of your trading, or your reliance on the information contained within this website.
It is prohibited to use, store, reproduce, display, modify, transmit or distribute the data contained in this website without the explicit prior written permission of Fusion Media and/or the data provider. All intellectual property rights are reserved by the providers and/or the exchange providing the data contained in this website.
Fusion Media may be compensated by the advertisers that appear on the website, based on your interaction with the advertisements or advertisers.
© 2007-2025 - Fusion Media Limited. All Rights Reserved.