Since the end of last week, world markets have been showing mixed dynamics and weakening of volatility. Asian markets are fluctuating in the range from -0.2% to +0.2% on Monday. The main U.S. indexes completed their trading session on Friday in the same range. The S&P 500 added 0.3% and Dow Jones lost 0.2%.
The movements of major world stock indices, as well as the leading currency pairs, have stalled, now approaching the significant levels of the last few months. Abnormally, there are currently many contradictory factors in the markets, and moods can change from excitement to panic in a few days. Therefore, investors and traders are waiting for the main factor which will outweigh and determine the future trend of the markets.
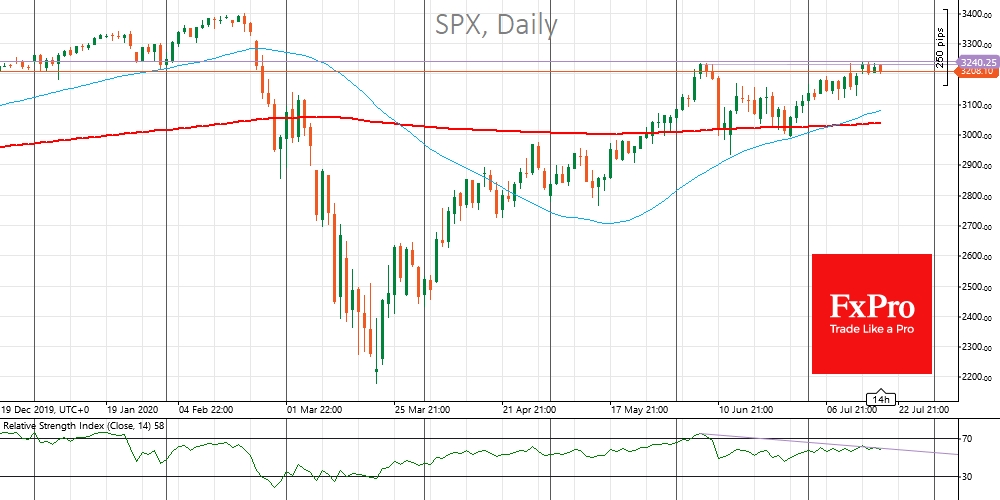
The S&P500 index is once again relying on the resistance of 3220-3240, last year's closing level, and opening level of the current year, as well as the correction area at the end of January. This area is important because of the 10% market correction in June when these levels were touched. The bears also benefit from a weakening growth momentum, as seen in the lower RSI values on the daily charts. On the bulls' side is the fact that the index is above the 50 and 200-day moving averages, as well as the maintenance of ultra-soft monetary policy combined with hopes for stimulus. A sharp movement above or below this line promises to generate a strong momentum, attracting increased attention from traders and investors.
In the currency market, the dollar index has retreated into the low of March. Corrective pullbacks of the last year and a half. As in the case of S&P500, it does not guarantee a reversal from this area for the dollar but attracts increased attention to the dynamics around current levels.
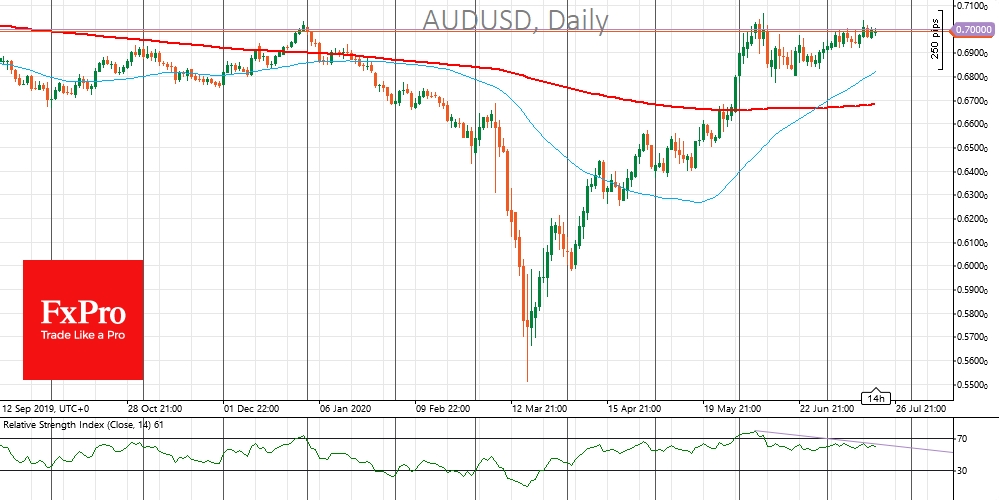
Something to separately note, is that AUD/USD fluctuates near 0.7000 and USD/CNH at 7.00. These pairs have repeatedly acted as a reliable mood barometer. Growth of Aussie and Yuan in these pairs often reflects the return of investor confidence in economic recovery and can spur demand for risk in the markets in general.
However, it is worth remembering that now the attention is focused less on the psychological importance of any levels in currency pairs, and more on the will of politicians. This week, the discussion of stimulus packages in the United States and Eurozone promises to become new drivers. Earlier this year, lawmakers acted relatively quickly and on a large scale, but recent weeks are increasingly showing signs of the return of the usual routine of endless discussions. As a result, the markets will follow the statements of the authorities with increased attention in the coming days.
The FxPro Analyst Team
- English (UK)
- English (India)
- English (Canada)
- English (Australia)
- English (South Africa)
- English (Philippines)
- English (Nigeria)
- Deutsch
- Español (España)
- Español (México)
- Français
- Italiano
- Nederlands
- Português (Portugal)
- Polski
- Português (Brasil)
- Русский
- Türkçe
- العربية
- Ελληνικά
- Svenska
- Suomi
- עברית
- 日本語
- 한국어
- 简体中文
- 繁體中文
- Bahasa Indonesia
- Bahasa Melayu
- ไทย
- Tiếng Việt
- हिंदी
Recovery Reaches Ceiling. What Could Drive Markets Higher?
Published 07/20/2020, 04:39 AM
Updated 03/21/2024, 07:45 AM
Recovery Reaches Ceiling. What Could Drive Markets Higher?
Latest comments
Loading next article…
Install Our App
Risk Disclosure: Trading in financial instruments and/or cryptocurrencies involves high risks including the risk of losing some, or all, of your investment amount, and may not be suitable for all investors. Prices of cryptocurrencies are extremely volatile and may be affected by external factors such as financial, regulatory or political events. Trading on margin increases the financial risks.
Before deciding to trade in financial instrument or cryptocurrencies you should be fully informed of the risks and costs associated with trading the financial markets, carefully consider your investment objectives, level of experience, and risk appetite, and seek professional advice where needed.
Fusion Media would like to remind you that the data contained in this website is not necessarily real-time nor accurate. The data and prices on the website are not necessarily provided by any market or exchange, but may be provided by market makers, and so prices may not be accurate and may differ from the actual price at any given market, meaning prices are indicative and not appropriate for trading purposes. Fusion Media and any provider of the data contained in this website will not accept liability for any loss or damage as a result of your trading, or your reliance on the information contained within this website.
It is prohibited to use, store, reproduce, display, modify, transmit or distribute the data contained in this website without the explicit prior written permission of Fusion Media and/or the data provider. All intellectual property rights are reserved by the providers and/or the exchange providing the data contained in this website.
Fusion Media may be compensated by the advertisers that appear on the website, based on your interaction with the advertisements or advertisers.
© 2007-2025 - Fusion Media Limited. All Rights Reserved.
