NASDAQ Vs NYSE: Volumes Speak

Published 08/23/2020, 01:37 AM
Updated 07/09/2023, 06:31 AM
US500
-
IXIC
-
NYA
-

In what type of stock universe is there exponential intrigue in the “New Economy” NASDAQ with very little interest in the “Old Economy” of the New York Stock Exchange (NYSE)? Welcome to the 2020 Pleasure Dome.
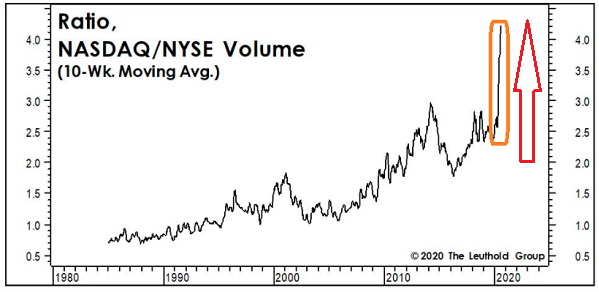
Nasdaq / NYSE Volume Ratio Chart

Perhaps ironically, corporate executive insiders have dumped more than $50 billion worth of shares since the start of May. Meanwhile, August should see insider selling exceed $15 billion for the third time in four months. (Hat tip to TrimTabs Research.)

Why are executives at so many public corporations unloading their stock shares? Wouldn’t they want their wealth to keep growing if they were confident in the current rally?

In all likelihood, these leaders see a challenging environment for their businesses. Even the new all-time highs for the S&P 500 occurred with the lowest participation of index constituents dating back to 2000.

In other words, there was relatively little faith in the stock bull right before the 2000 tech bubble burst. Will the NASDAQ stock bubble explode here in 2020?
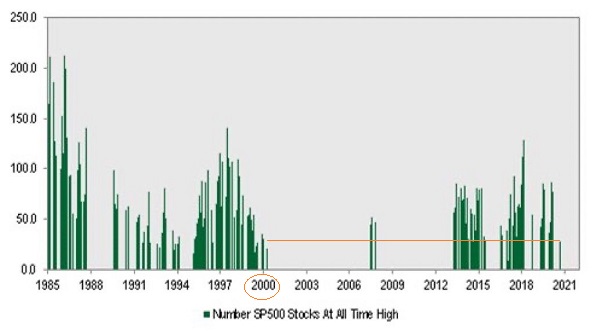
S&P 500 Stocks At All Time Highs

Latest comments

Loading next article…
Risk Disclosure: Trading in financial instruments and/or cryptocurrencies involves high risks including the risk of losing some, or all, of your investment amount, and may not be suitable for all investors. Prices of cryptocurrencies are extremely volatile and may be affected by external factors such as financial, regulatory or political events. Trading on margin increases the financial risks.
Before deciding to trade in financial instrument or cryptocurrencies you should be fully informed of the risks and costs associated with trading the financial markets, carefully consider your investment objectives, level of experience, and risk appetite, and seek professional advice where needed.
Fusion Media would like to remind you that the data contained in this website is not necessarily real-time nor accurate. The data and prices on the website are not necessarily provided by any market or exchange, but may be provided by market makers, and so prices may not be accurate and may differ from the actual price at any given market, meaning prices are indicative and not appropriate for trading purposes. Fusion Media and any provider of the data contained in this website will not accept liability for any loss or damage as a result of your trading, or your reliance on the information contained within this website.
It is prohibited to use, store, reproduce, display, modify, transmit or distribute the data contained in this website without the explicit prior written permission of Fusion Media and/or the data provider. All intellectual property rights are reserved by the providers and/or the exchange providing the data contained in this website.
Fusion Media may be compensated by the advertisers that appear on the website, based on your interaction with the advertisements or advertisers.
© 2007-2025 - Fusion Media Limited. All Rights Reserved.