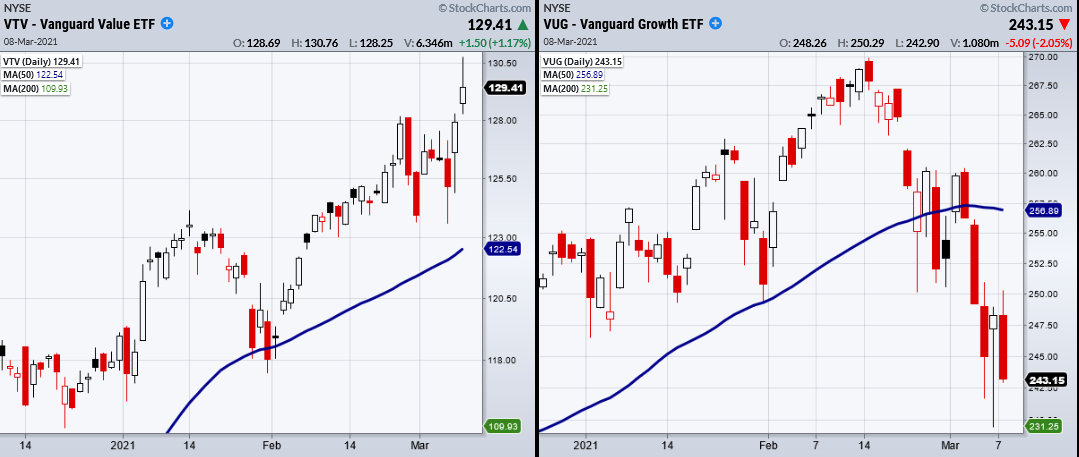
Monday’s strange price action looks as though the market shrugged off the stimulus money in some areas, yet not others.
While there are many factors at play, the most notable shift is in big tech, which continues to show weakness.

The tech heavy index NASDAQ 100 (QQQ) sold off through the day, which is showing a shift from growth stocks into value stocks as yields rose rapidly.
Monday, the Vanguard Value Index Fund ETF Shares (NYSE:VTV) broke to new highs while Vanguard Growth Index Fund ETF Shares (NYSE:VUG) continued to break down.
Is it possible that after 12 years of seeing growth over value, with every correction a buy opportunity for big tech, the reverse of that is now true?
This change could mean that every dip is now the opportunity to buy value stocks instead. The last time value overtook growth gains for an extended period was around 2002-2007. This came after the Dot-Com-Bubble, which peaked in 2000.
While the Dot-Com-Bubble is completely different to a pandemic, it is interesting to note. Of course, any reversal in yields could take many oversold tech stocks into a dead cat bounce. But for now, growth and tech are the Debbie downers of Monday.
One sector their influence did not reach was the transportation sector (IYT), which broke to new highs. This sector indicates investors’ confidence that travel will continue to reopen along with an increase in the flow of goods. Therefore, as we watch for further economic recovery, IYT remains an important leader moving forward.
- S&P 500 (SPY) 381.48 the 50-DMA needs to hold.
- Russell 2000 (IWM) Lots of resistance from 224-230.
- Dow (DIA) Broke to new highs but needs clear and stay over 320.
- NASDAQ (QQQ) 297.45 recent low.
- KRE (Regional Banks) New highs.
- SMH (Semiconductors) Next support 210 area.
- IYT (Transportation) Needs to hold 240 as new support.
- IBB (Biotechnology) Main support the 200-DMA at 143.31.
- XRT (Retail) Cleared resistance. 88.11 next resistance.
- Volatility Index (VXX) Showing some consolidation.
- Junk Bonds (JNK) 107.17 200-WMA.
- LQD (iShares iBoxx $ Investment Grade Corp Bond ETF) Needs to find support.
- IYR (Real Estate) Held the 50-DMA at 86.30.
- XLU (Utilities) Touched the 200-DMa 61.05.
- GLD (Gold Trust) Watching to find support.
- SLV (Silver) 22.94 support.
- VBK (Small Cap Growth ETF) Needs to clear and hold over 270.
- UGA (US Gas Fund) 31.77 support the 10-DMA.
- TLT (iShares 20+ Year Treasuries) 136.61 recent low.
- USD (Dollar) 91.60 new support. Resistance 92.89.
- EZA (South Africa) 49.55 resistance. Support 45.97.
- EWW (Mexico) 40.20 support. 42.66 resistance.
- MJ (Alternative Harvest ETF) Needs to hold over 20.73.
- WEAT (Teucrium Wheat Fund) Support 6.15.
