Commentaries ranging from crash predictions to skepticism about a correction-less rally are found not only in the financial but also nontraditional headlines. The latest commentary is posted in the Style section.
The Stock Traders Almanac notes:
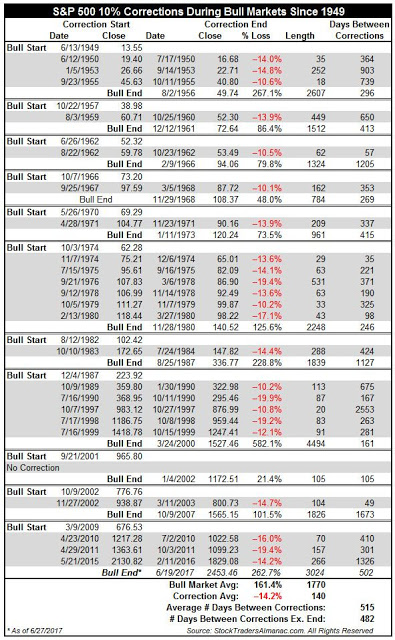
It has also been 502 calendar days since the last S&P 500 correction of 10% or more which nearly equals the average duration between corrections since 1950 of 515 days (table).
Couple of observations:
First, studying corrections since 1949 is simply too short of time. The study of cycle, an important component of historical analysis, requires at least 20 independent observations of 'unique' data points. It takes nearly a hundred years of data to compile 20 independent observations of stock market performance within the first year of the 4-year business cycles. This number goes up as longer cycles are studied.
Second, while the Matrix is defining increasing misalignment/consolidation across US stocks indices, it's not showing any focused bear opportunities. Large declines usually occur under focused bear opportunities.
In addition, not all consolidations produce meaning declines. Again, the computer shows us that.
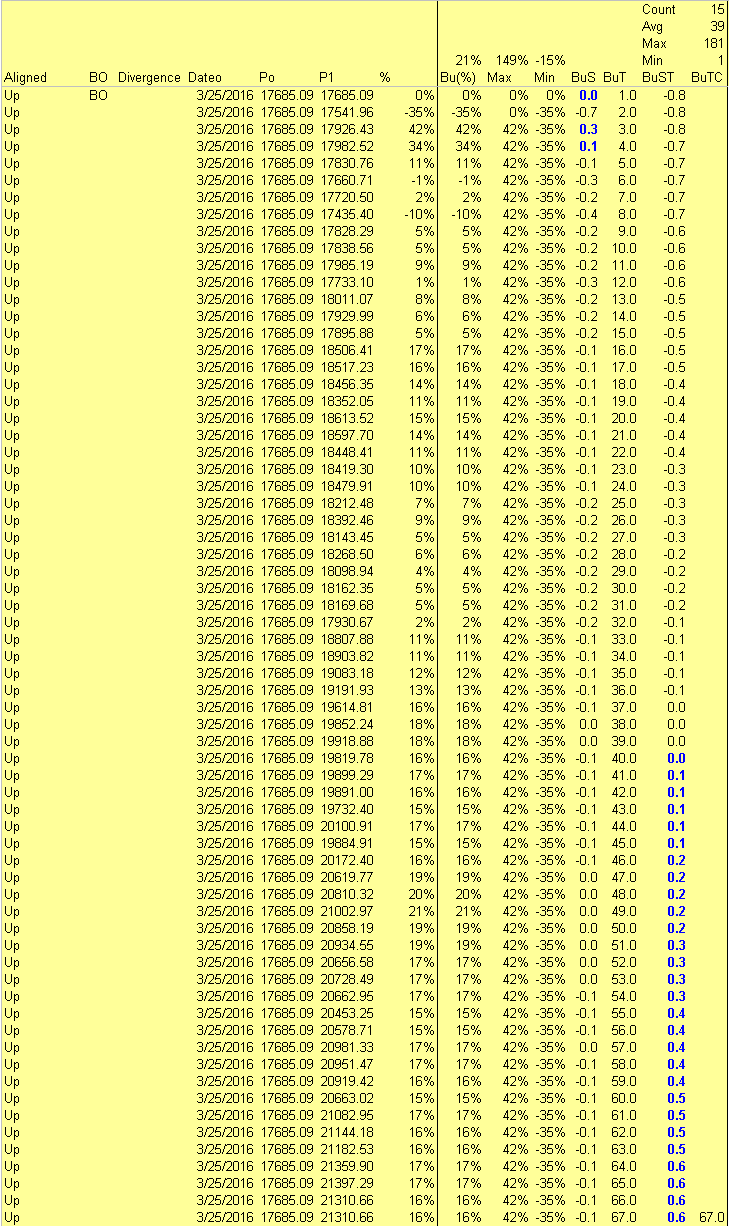
Third, the Dow Industrials' current up impulse, generated through the alignment of price and volume, is entering its 68 week (table 2). Although 68 weeks is well past the average duration of 39, it's still relative young when compared to the max duration of 181 weeks. 181 weeks is only the max duration through 1999. The historical max is likely much higher.

Headline: S&P 500 Correction Counter Reaches 502 Days
After narrowly bucking the trend of poor performance during the week after June option expiration week, by a little more than 10 points, Dow Jones Industrial Average and the rest of the market is stumbling early in the final week of Q2 and the first half. Tech and small-cap were the biggest decliners today as the IMF cut its growth forecast for the U.S. from 2.3% to 2.1% for 2017 and trimmed its 2018 outlook even more, from 2.5% to 2.1%. Debt, labor force participation, a 13.5% poverty rate and the increasing likelihood that meaningful policy changes would materialize were among some of the main drivers that led to this downtrodden outlook.

