The world’s financial markets are the very picture of calm and tranquillity, where the short sellers are getting squeezed and the bulls are once again dominating.
The MSCI World stock index (trade the URTH ETF) is trading at a new all-time high. European markets have found their mojo and whether we look at the set-up on the DAX or the EU stocks 50 indexes, the current set-up on the daily chart suggests the higher probability trade is for higher levels here. The S&P 500 is a whisker away from the all-time high of 2490.87 set on 8 August, and we will be watching the S&P 500 futures through Asia today to see if the futures index can print a new high here. Both the Dow Transports and the Russell 2000 index closed 1.1% higher, giving the move in equity markets real backbone, while we can see 88% of stocks higher on the S&P 500, showing solid breadth in the days buying.
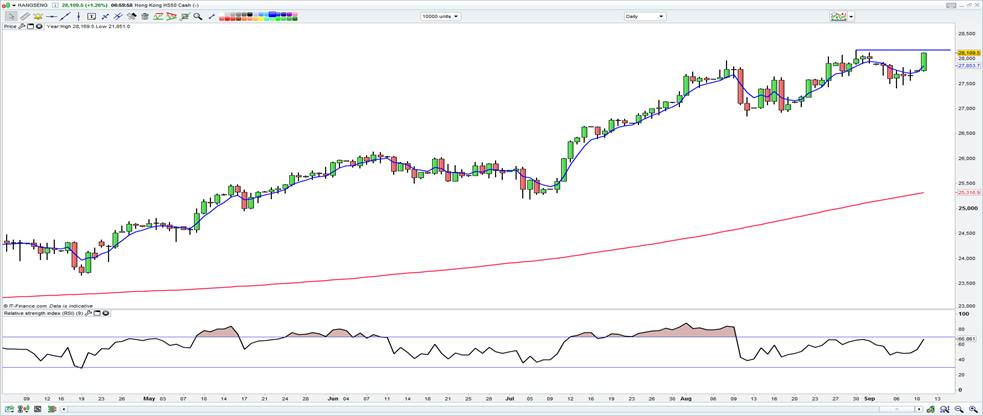
In Asia, we can see very bullish set-ups in the Hang Seng and India 50 (happy to be long these markets), while the ASX 200 and Nikkei 225 are pushing closer towards the top end of their trading ranges.

We have also seen some strong performance from US high yield corporate credit, with spreads coming in 11 basis points (investment grade credit spread closed 3bp tighter), and again this highlights that today’s US session was of good quality, backed by S&P 500 volumes 7% above the 30-day average. All sectors have rallied, providing Asia with a solid platform to move higher, despite many of themes which have pushed up European and US markets playing out in our time frame yesterday and thus partially in the price.
Perhaps a good way to visualise this pricing is that despite S&P 500 futures trading up 0.4% at the ASX 200 close yesterday (at 16:10 aest), we can see they sit 0.6% higher from that point. It’s no surprise, therefore, that SPI futures are trading up 31 points (or 0.5%) and our call for the Aussie equity market suggests an open at 5740. So, while traders had bought into Aussie (and broader Asian) stocks yesterday, on the idea that Hurricane Irma is unlikely to cause the damage some had feared, and the rebuilding process will add to growth in the quarters ahead, not to mention the absence of anticipated missile tests from North Korea, most of this news flow is in the price. However, there is no doubt that sentiment has picked-up here and implied volatility has moved lower with a certain calmness returning to markets.
Interestingly, we can see that the broad improvement in financial conditions has propelled market pricing around potential tightening from the Federal Reserve this year from around 25% (on Friday) to currently sit at 35%; so a chunky move in Fed expectations. The US 2’sv 10’s fixed income curve has steepened a touch to 81 basis points (bp), with selling in longer-term rates somewhat more aggressive than that of short-term rates. This, in turn, has lifted US financials by 1.7% (and should support Aussie banks), with the US dollar index (DXY) gaining 0.7% and the greenback rallying against all G10 currencies, expect the CAD, which is the star of the FX show. USD/JPY has been well traded and finds itself pushing into ¥109.50 and eyeing a move into key supply seen in the ¥111.00 to ¥110.50.
AUD/USD is also on the radar, as this pair is over owned in a huge way and Friday’s pin bar reversal is playing out in textbook fashion, with the pair moving into the lower 80c level and the probability that a short-term move into $0.7950 to $0.7900 looks ominous. Today’s NAB business confidence print (released at 11:30 aest) shouldn’t move the pair to any great capacity.
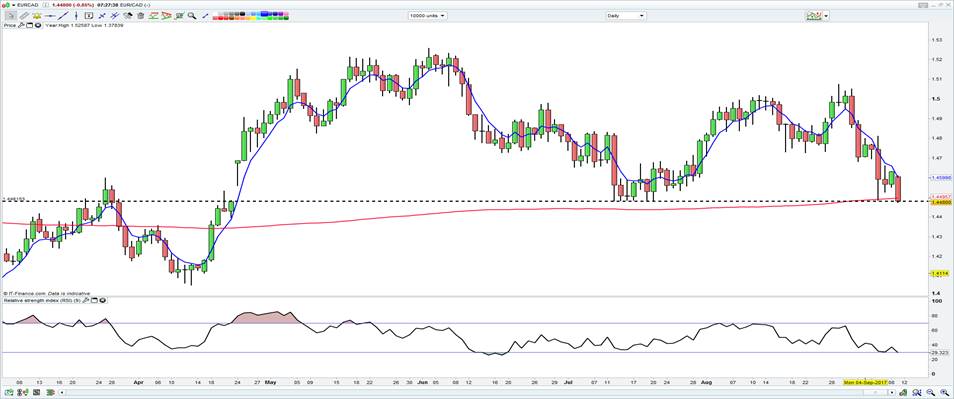
My set-up of the day is EUR/CAD though and a close through c$1.4480 (strong horizontal support through July) would open up sizeable downside risks. One for the radar.

Back in equity land, we saw a strong rotation from funds switching from ASX materials into financial stocks yesterday. Well, today we should see both sectors working higher today with BHP expected to open 1.6% higher and Vale’s US-listing closing 1.3% higher, so both names indicate a more upbeat feel to Aussie miners. US crude prices have closed 1.3% higher and have retraced close to 50% of the losses seen on Friday. Spot iron ore was smashed 5%, but more importantly has been the 1.8% and 1% rally in iron ore and steel futures traded on the Dalian exchange in China. Coking coal futures have risen an impressive 4.2%.
Gold stocks have had their time in the sun, it seems, and the moves higher in US bond yields and the USD have seen gold move 1.5% lower. The gold miners ETF (GDX (NYSE:GDX) ETF) closed lower by 2.7% on the NYSE. Importantly, spot gold is holding $1326 (the 29 August high and also 5 September low), so a break below here could see the metals target $1300/1299, although this will be dictated to by the short-term moves in US bond yields, which in turn will take direction by the two key event risks for the week: Thursdays core CPI and Fridays US retail sales report. The gold bulls will want to see a weak number in both reports, causing ‘real’ yields to head back lower.
