There has been somewhat of a risk-off tone to markets, although there doesn’t seem to be a smoking gun and there really is no panic!
The fixed income market has been interesting, with good buying across the developed market spectrum. We can see the U.S. 10-year treasury down 5 basis points at 2.41% and interestingly we can see U.S. 5-year inflation expectations threatening to break below the 2% level (this was as high as 2.18% on the 19th January). If we go more short-term and look at the interest rate markets (I’ve looked at Fed funds future) we can see the market pricing in less than two hikes over the coming 12 months, the first time we have seen less than 50bp priced since 13 December.
Perhaps the bigger issue in fixed income has been the stress seen in the French bond market, with the France 10-year bond commanding the highest premium relative to German bunds since November 2012 (gaining 10bp on the day to 76bp). Clearly the French elections are causing some angst and we are seeing greater signs that investors and portfolio managers are reducing or hedging their exposure to French assets.
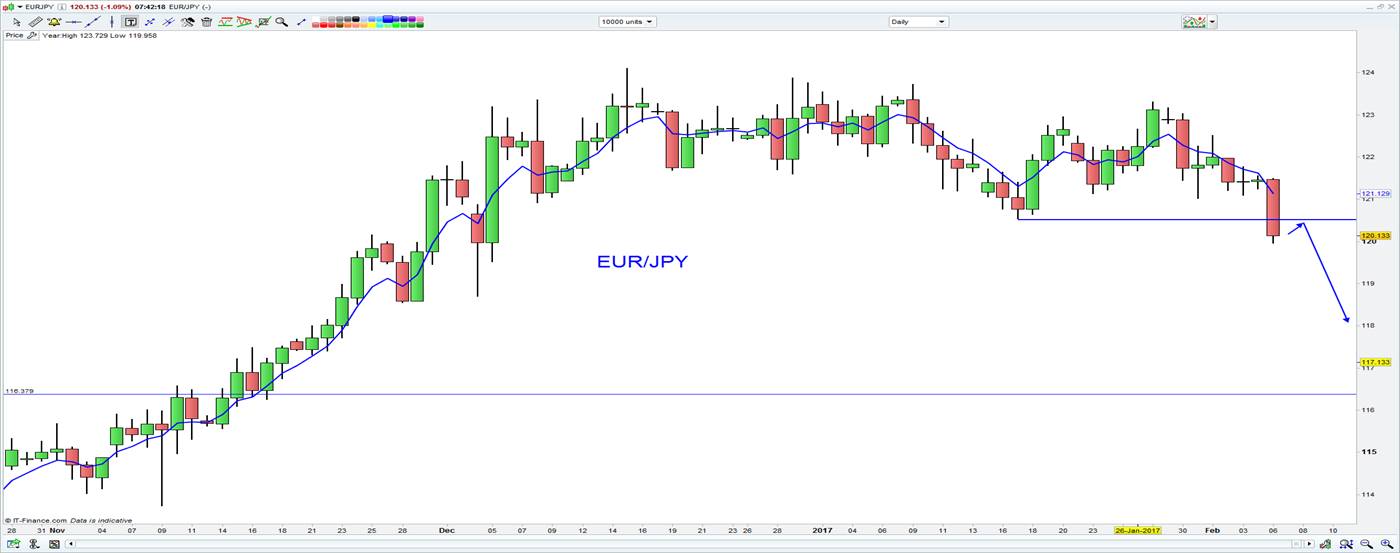
Rather than play the fixed income market retail traders are going into the FX markets and shorting EUR/JPY, so this is on the radar here with price breaking through the January lows and I wouldn’t be surprised to see this trading closer to ¥119-¥118 fairly soon.


In FX land, the JPY has been the play of the day, with USD/JPY also breaking the year’s lows and levels where the buyers have been happy to step in really since the 17 January. The bears are in control here and the buyers have shown no interest in supporting price either at the 38.2% retracement level of the November to January rally at ¥112.00. The next stop is the ¥110.00 to ¥109.93 Area.
AUD/USD has held up fairly well, trading in a range of $0.7691 to 0.7629 and of course it’s all about the RBA meeting today at 14:30 AEDT.
Honing in on the RBA meeting, it seems no one is really positioned for fireworks today and all signs suggest this is more a fact-finding mission for traders, to gain a view of how the RBA see the world since the last meeting on 6 December. In that time we have seen a terrible Q3 GDP print, a fairly bleak inflation print (with annualised core inflation falling 10bp from Q3 to sit at 1.6%) and a record monthly trade surplus.
It is worth highlighting that since the prior meeting Aussie five-year inflation expectations have dropped 10bp to 1.75%, the AUD (trade-weighted) and AUD/USD have gained 2% and 2.6% respectively, while spot iron ore has gained 1% and the ASX 200 is up 4%. Hardly seems thematic of central bank radically changing its tune from December and away from financial stability. The swaps market has priced a 4% chance of a cut today, which is fair, although I see this at zero.
I would expect Fridays RBA Statement on Monetary Policy (SoMP) to be the bigger affair with the potential for a fairly punchy cut to its GDP forecasts following on from the 0.5% contraction in growth in Q3. One finds it hard to believe they will maintain its current estimate for end 2016 and June 2017 of 2% (the mid-point of their 2.5% to 3.5% range). We could also be staring at slight changes to the bank’s core inflation forecasts for mid-2017 as well.
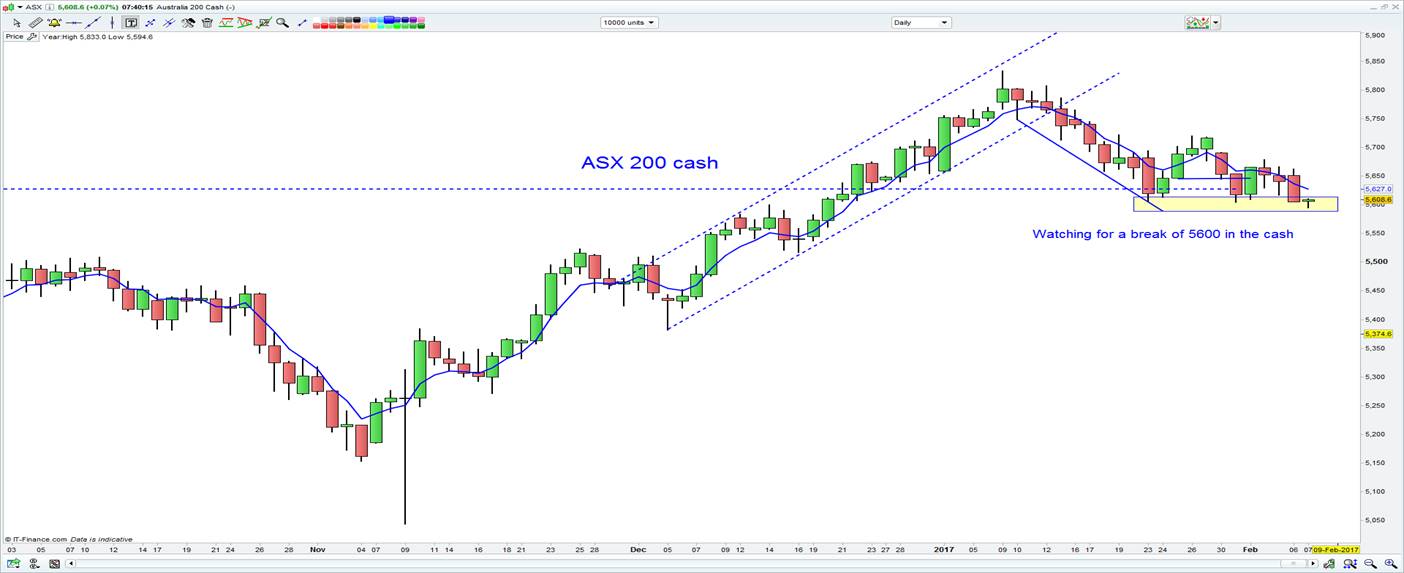
However, I would be surprised if we saw too much reaction from today’s RBA meeting in equity prices and as things stand we expect an open around 5608 (-7 points). The fact the index closed close to the day’s low yesterday at 5615 is quite telling, so it will be interesting to see how the market fares from around 10:30 AEDT. SPI are down nine points with price trading down to 5540 at one stage and a new low for the year. Some buying has been seen of late though and we may see a close above the prior year low of 5550. As mentioned before, a close below here and we are looking at a move into 5400.

Another telling factor behind the slight risk-off feel has been the reasonable move lower in U.S. crude (-1.5%), with traders citing the weekend Baker-Hughes rig count increase of 17 rigs, which we flagged yesterday. The S&P 500 energy sector has been the hardest hit, so one can expect Aussie energy names to come under some pressure. Gold stocks should go the opposite way with spot gold reacting positively to lower bond yields and the weakness in the USD (well, USD/JPY) and eyeing a move to my target of $1241, after having convincingly broken through $1218 area.
Keep an eye out for China’s January FX reserves (no set time for release), with calls reserves could fall a further 2.3% to just north of $3 trillion. A move through $3 trillion could become a larger talking point in the days ahead and we start talking about China capital outflows again.
