The weekend news flow has centred on Donald Trump’s inauguration, Sean Spicer’s rather angry press conference and the administration’s strategy of withdrawing from TPP. These events are not immediately market moving in themselves and the debate that rages through markets (above all others in my opinion) is whether “Trumponomics” truly generates the levels of animal spirits and increases in investment and productivity to create 4% growth and 2.5 million jobs (over the coming decade).
The answer to dynamic will take time to materialise, although we have seen some positive trends in small business confidence and the new orders sub-component of the US services and manufacturing ISM.
With this in mind, US growth will be in focus this week, although as I say the market is more concerned with future growth, specifically when we have a far clearer idea on the fiscal policies and the Republican plans actually start to kick in. The current consensus for Friday's Q4 GDP print sits at 2.1%, which is in-line with the New York Fed’s NowCast model, although the Atlanta Fed’s model is a more impressive 2.8%. While there is much data still to come before the Q1 print is released the NY Fed have 2.66% set at this stage.
The guide for markets continues to come from the US fixed-income market, where on Friday there was strong indecision from both the bull and bear camp. Yields are starting to creep higher again, but whether there is the impetus to head towards the 15 December high of 2.63% (on the 10-yr) is another thing. The USD is of course key for global markets, especially when the world (source: BIS) some $55 trillion in US denominated debt and while the USD will follow yields in the bond market we can also see the USD index still holding the 100 level. Interestingly, we can see US five-year inflation expectations still holding up nicely at 2.06% and I see this as a good guide on all things Trump.
The S&P 500 is moving almost perfectly sideways, as highlighted by the flat move in the 20-day moving average. A two standard deviation move either side of this short-term average gives us a trading range this week of 2284 to 2246 and this should contain moves for now, especially with the RSI in the middle of the range and implied volatility at such low levels. The US equity market is a range trader’s paradise and one questions whether earnings could throw the broader index around a bit more this week with 29% of the S&P 500 market cap reporting.
With around 13% of US corporates having reported thus far, we have seen 74% beating on the earnings line (by an average beat of 3.4%) and 47% on sales. As a whole, we have seen 3.4% aggregate earnings growth and it won’t surprise this is largely driven by the financials where we have seen EPS growth of 9.3%.
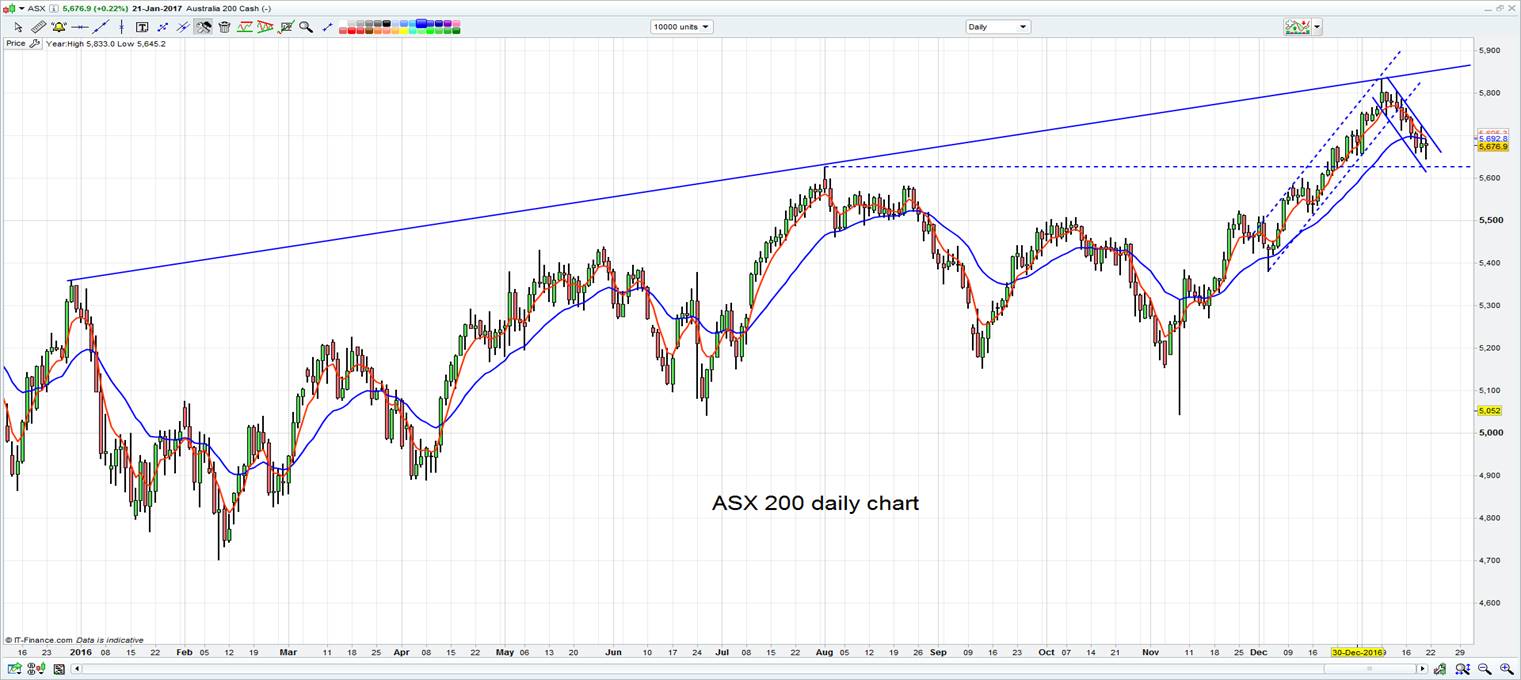
The 0.3% rally in the S&P 500 on Friday should support Asian markets today, with good leads notably for materials (the S&P 500 materials sector closed up 0.9%) and our call for the ASX 200 sits at 5675 (+21 points). It’s interesting to focus on price action in the local market, with the bears seemingly in control. The Aussie index has dropped 3% since 9 January, but in that move the index has printed five lower lows and has only once managed to break the prior days high, although the sellers immediately came back in. So the question of the day remains whether the market uses this early strength to offload holdings.
In a strong trend one will tend to find moves into the five-day average contained and this is the case here, so I would be using any rallies into this average (now at 5695) to increase bearish exposure, although strong support kicks in around 5611 to 5625 (1 August high) and it will be interesting to see if we see the buyers kick in here.

The various ADR’s are not given us too much, with BHP’s adr closing +6c, CBA +8c and WPL -4C.
Locally, the highlight of the week remains the Aussie Q4 inflation print on Wednesday (at 11:30 aedt), with the consensus expecting headline inflation of 0.7% qoq and underlying inflation of 0.5% qoq. Interestingly, we have seen five-year inflation expectations in Australia moving from 1.32% in July to currently sit at 1.90% (the highest level since March 2016), while the swaps market is pricing in 11bp of tightening over the coming 12 months.
Of course, AUD/USD will be sensitive to this data flow, especially with the hedge fund community running an almost perfectly neutral position and funds searching for further clues on the path of the RBA. On Friday, price traded in a range of $0.7588 to $0.7515 and continues to hold the 75 handle despite bulks under pressure (spot iron ore fell 0.7%, while iron ore, rebar and coking futures lost 2.9%, 2.3% and 3.7% respectively).
Which stock should you buy in your very next trade?
With valuations skyrocketing in 2024, many investors are uneasy putting more money into stocks. Unsure where to invest next? Get access to our proven portfolios and discover high-potential opportunities.
In 2024 alone, ProPicks AI identified 2 stocks that surged over 150%, 4 additional stocks that leaped over 30%, and 3 more that climbed over 25%. That's an impressive track record.
With portfolios tailored for Dow stocks, S&P stocks, Tech stocks, and Mid Cap stocks, you can explore various wealth-building strategies.
