Get out your party hats ladies and gentlemen, the S&P 500 closed at all-time highs on Friday, finally eclipsing the January peak. After 145 days of slogging, the “bull market is back, baby!”
Well, at least for now.
Last week, we discussed how the market has become distracted from the bigger picture by any piece of news that supports the bullish narrative. But, as Jerry Seinfeld once quipped: “Not that there’s anything wrong with that.“
The bullish momentum has kept stocks buoyed over the last several months and during that time we have been increasing equity exposure since March opportunistically using pullbacks to do so. Despite concerns of a political debacle in the White House, the markets rose last week on hopes the “trade dispute” with China would be quickly resolved. That hope vanished on Friday as Bloomberg reported:
“The trade war between the U.S. and China is primed to escalate after their governments failed to make progress in two days of talks.
The two sides had met with low expectations for this week’s meetings and no further talks had been scheduled, a person familiar with the discussions said. The person, who requested anonymity to discuss the private deliberations, also said Chinese officials had raised the possibility that no further negotiations could happen until after November’s mid-term elections in the U.S.”
Oh, and remember the whole “North Korean” deal? Yeah, that is over too. (As I stated two months ago, it was “all show and no go” for North Korea. There was never any intention of actual denuclearization.)

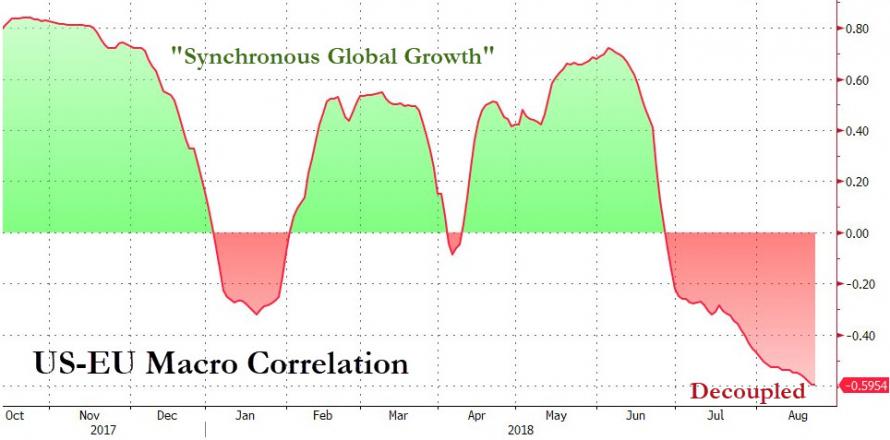
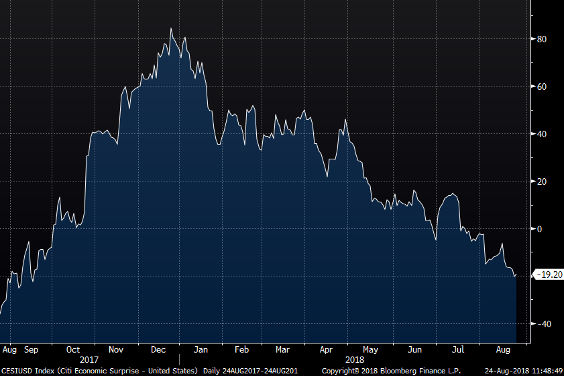
Furthermore, Germany has begun to look to move away from the U.S. dollar. Russia remains a geopolitical risk. The Iranian saga continues and, most importantly, the “global economic acceleration is over.” (chart courtesy of Zerohedge)
Regardless of all those reasons to be concerned, attention was quickly shifted to focus on Jerome Powell’s Jackson Hole “sentence.”
“The economy is strong. Inflation is near our 2 percent objective, and most people who want a job are finding one. My colleagues and I are carefully monitoring incoming data, and we are setting policy to do what monetary policy can do to support continued growth, a strong labor market, and inflation near 2 percent.
There is good reason to expect that this strong performance will continue. I believe that this gradual process of normalization remains appropriate.“
Well, what did you expect him to say?
“The economy is doing okay, but real wage growth and full-time employment for most American’s remains elusive. Real inflation, when you look at what the average household deals with is north of 5% and our policy actions have really done nothing more than enrich all of our friends here in Washington and on Wall Street.”
I know…it’s a bit “tongue-in-cheek,” however, any statement that was not strongly supportive would have sent asset prices plunging. Of course, with the President already “not so happy” with Jerome Powell anyway, it keeps concerns of interference from the White House minimized.
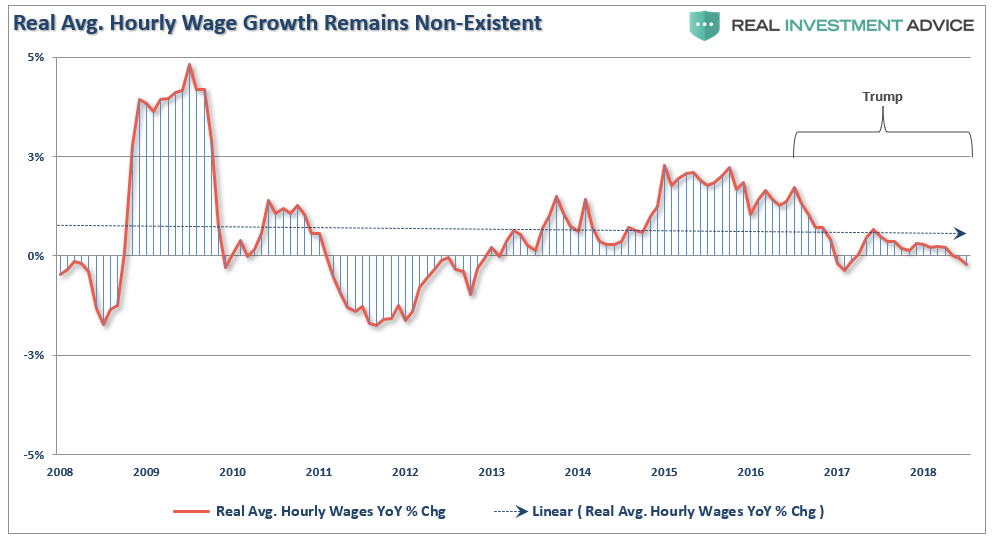
However, while “revised” statement was entirely sarcastic, is not so far from the truth as shown in the charts below. It is hard to support the claim that “anybody who wants a job can find one.” It is full-time employment that supports home buying and increased consumption in the economy.
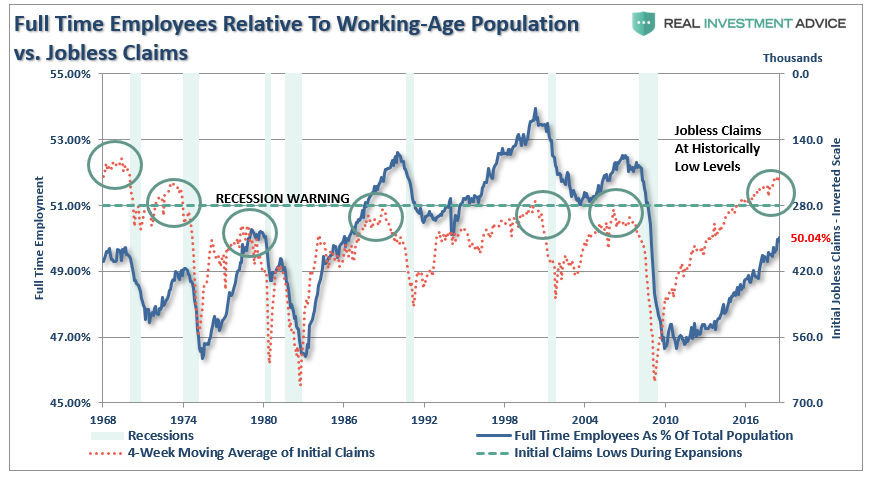
“But, that’s because all the ‘baby boomers’ are retiring.
Okay, let’s strip them all out.
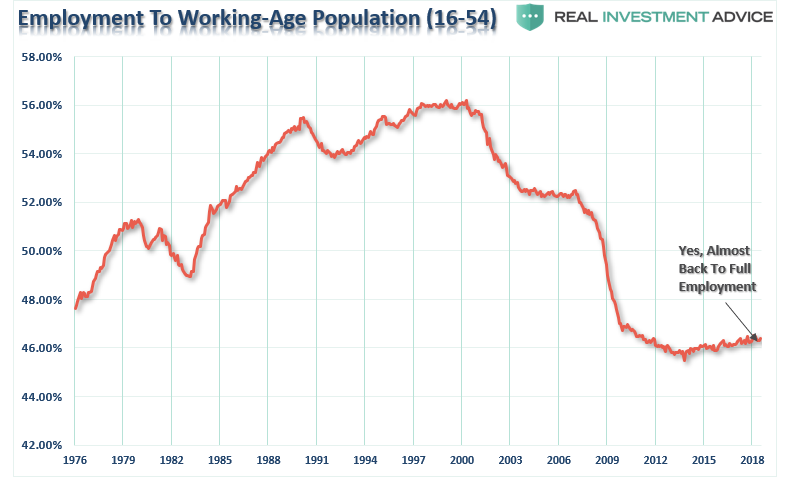
And…wage growth remains non-existent.
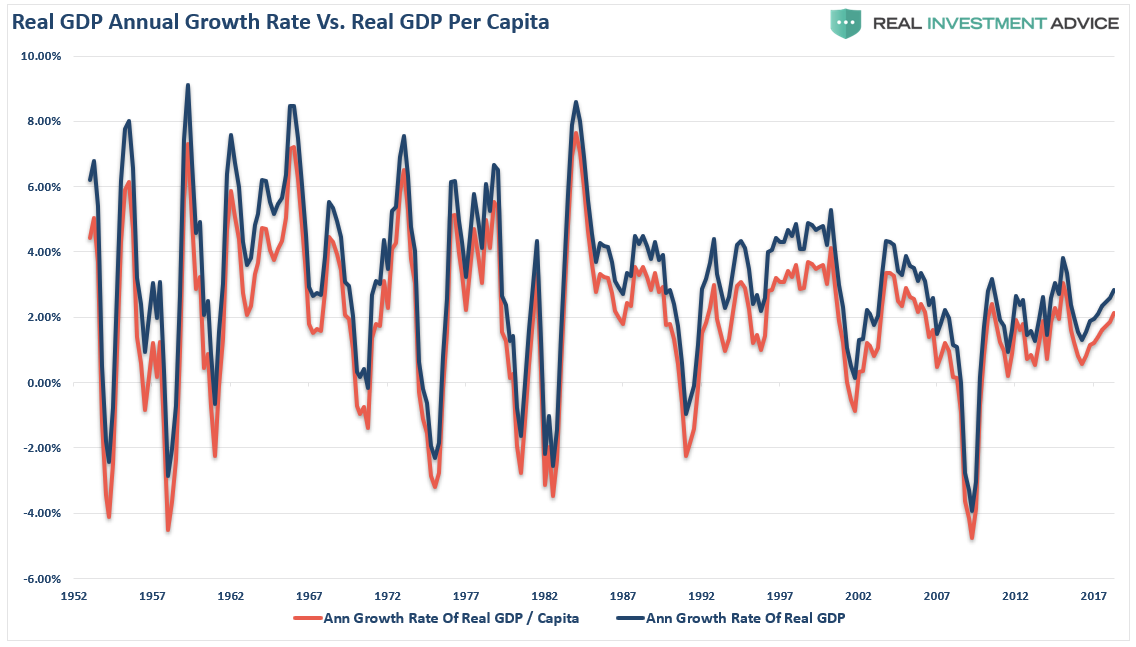
Yes…the economy has indeed grown since the recessionary lows, but “strong” is not exactly the word to use. Furthermore, the bounce from the 2016 slowdown coincides directly with the billions spent on natural disaster recovery from 2017. That “stimulus” has likely reached its end.
As Doug Kass noted late on Friday, the Citigroup Surprise index doesn’t really agree with Mr. Powell’s statement either.
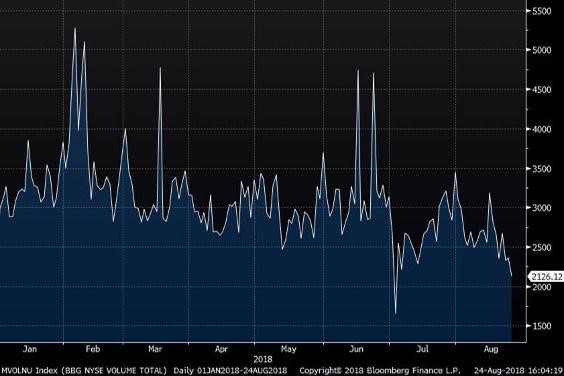
And neither did traders.
“Today was by far the slowest volume trading day of the year, not including the half day on July 3rd. “ – Doug Kass
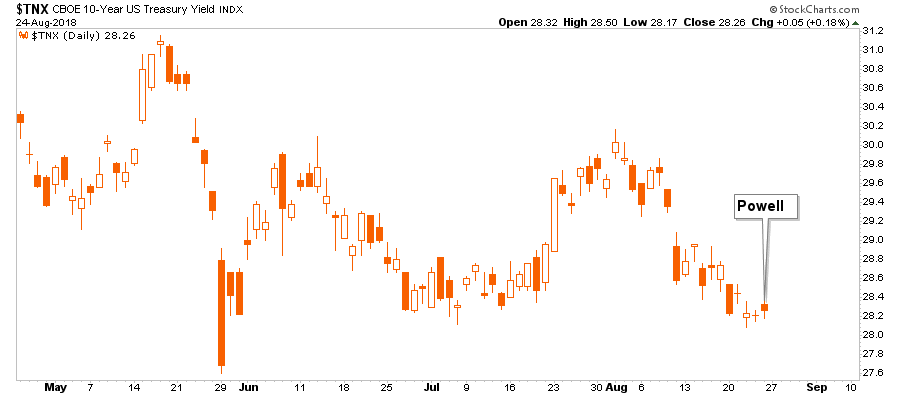
And bonds simply aren’t “buying it.”
Nonetheless, stocks not only hit all-time highs on Friday, but by the mainstream media’s measures it also qualifies as the longest bull market in history.
My friend, David Rosenberg from Gluskin-Sheff, brought a little sanity back to the conversation:
“Keep in context how weird it is to have the longest bull market in equities in the context of the weakest economic expansion of all time, and how do you square that circle? It’s because of the long arm of the central banks.”
While the Fed is in the process of trying to reduce their balance sheet, there is still plenty of liquidity sloshing around as financial conditions remain extremely easy.
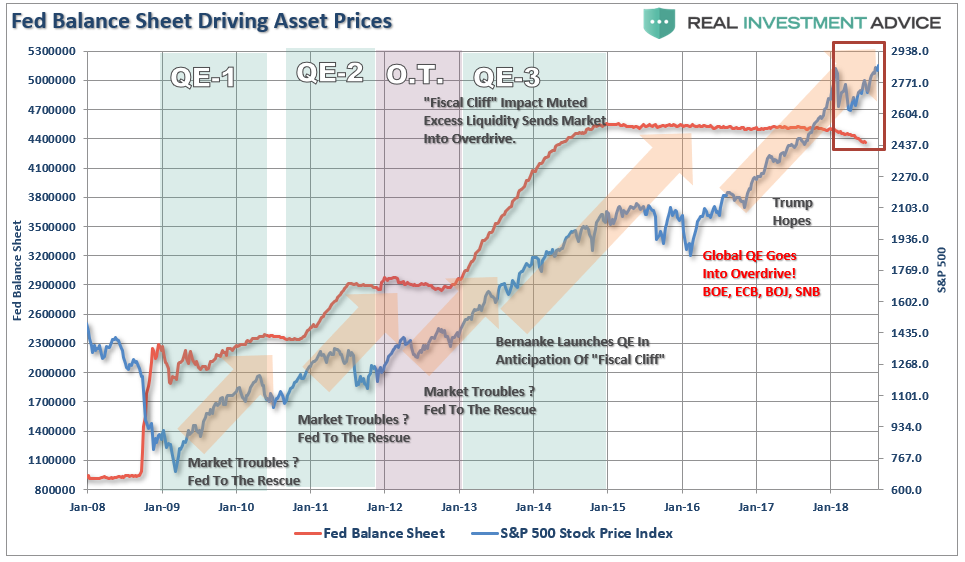
And timely injections of liquidity into the financial markets never hurts.
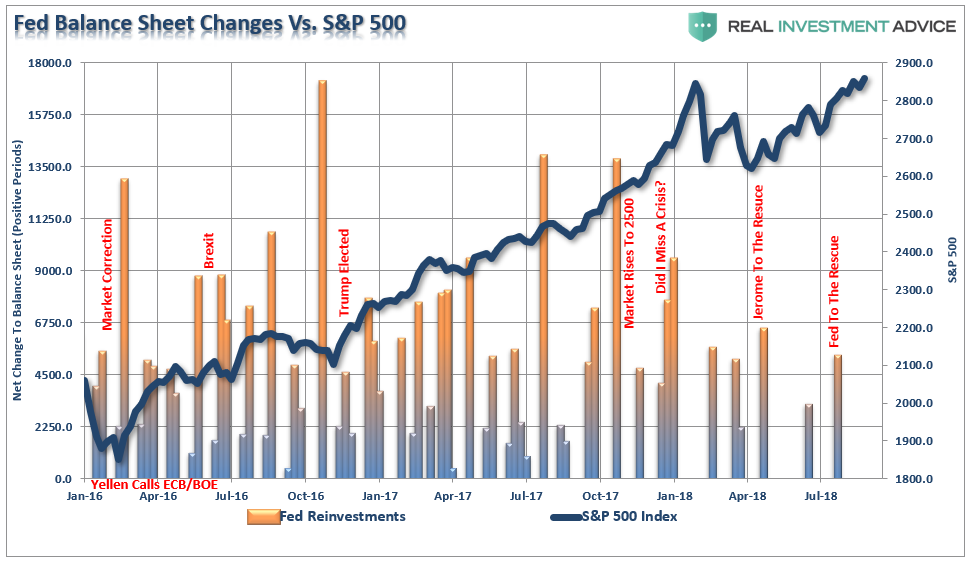
While the market was temporarily distracted by “Jerome Powell” on Friday in the rush to push the S&P 500 to “all-time highs” (insert roar of crowd), earnings season is coming to its conclusion and all eyes will refocus back on trade, tariffs, and geopolitical risks.
I noted the biggest threats we are watching last weekend:
- Technical deviations
- Emerging market debt and economic stabilities
- U.S. dollar strength
- oil prices (below $60)
- Interest rates (Fed)
- Economic strength
- Earnings
- Leverage (Margin)
As I stated then, the issue isn’t any one of them in particular – but the linkages between all of them which is important to watch.
We can now add back to that list:
- Geopolitical Risk (China, Russia & North Korea)
- Tariffs
- Trade
- The Fed
Again, it is never just “one thing” that causes a reversion. Rather, it is the “one thing” that triggers the cascade of dominoes to fall.
Unfortunately, we generally never know what the “one thing” is until after the fact. This is why having a plan to manage risk, a discipline to act, and a process to follow which is critically important to long-term investing success.
Still Long Markets, But September Approaches
While I point out the prevailing risks, and the disconnect between bullish sentiment and hard data, the reality is the bull market remains intact.
Over the last several months we have been tracking the progress of the S&P 500 with pathways back to “all-time” highs. The very quick retest of support, as noted last week, set the stage for the push to market highs.
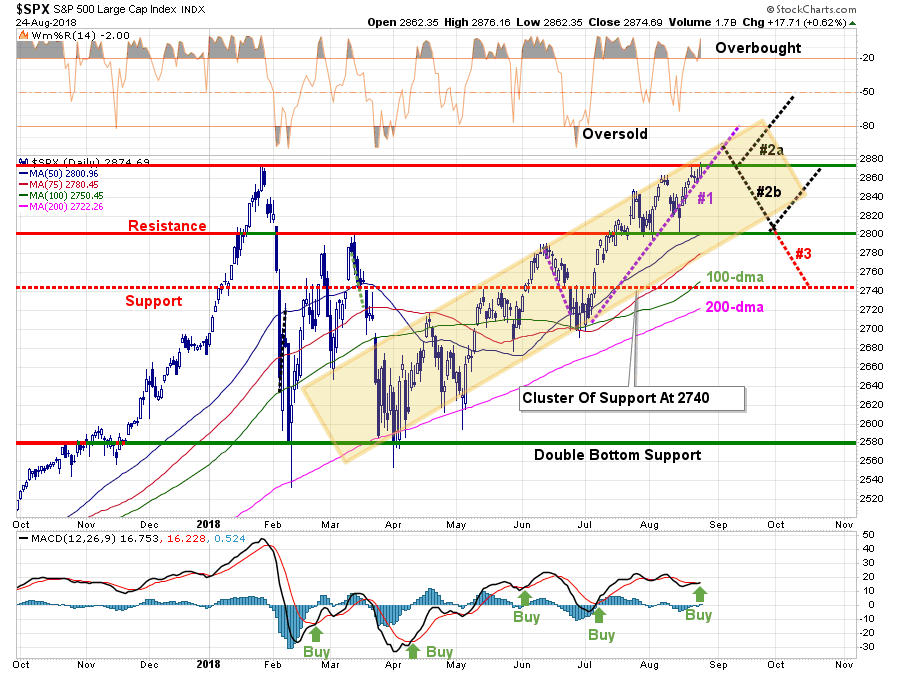
With portfolios still long-biased, the question is what happens next, and how to play it.
I have updated our pathway analysis to account for the breakout to new highs and the fact we are heading into September which has one of the poorest historical performance records.
- Pathway #1: An uninterrupted advance of the bull market with an expansion of volume and market breadth. This is a lower probability event currently given the extreme short-term overbought condition, light volume of the breakout and a negligible “buy signal” in place. (20%)
- Pathway #2: Is a bit more of an “exuberant” advance early next week which pulls back to the recent breakout level. The pullback consolidates a bit, works off some of the overbought condition, and then begins the next advance. Such a pullback would turn the previous resistance into support and provide a short-term “buyable” entry. (30%)
- Pathway #2a: Is a higher probability event given the overbought conditions currently. A pullback to 2800-2820 which works off the overbought condition and builds support at previous bottoms. This would also coincide with a “September” type performance and would set the stage for a traditional year-end rally. This would provide the best opportunity to bring portfolios to target weights. (40%)
- Pathway #3: This path is the least likely currently, but should be considered nonetheless. With all of the risks laid out above, something that triggers a credit-related worry in the market could send stocks lower. There is strong support built at 2740 which should initially hold. If it doesn’t we have other issues to discuss. (10%)
Again, with portfolios primarily invested, there is little for us to do. We did let some weak performers go last week and will look for a pullback to add to winners and make some new bets.
As always, when it comes to your portfolio:
“Do more of what works, and less of what doesn’t.” – Dennis Gartman
See you next week.
Market and Sector Analysis
Data Analysis Of The Market & Sectors For Traders
S&P 500 Tear Sheet
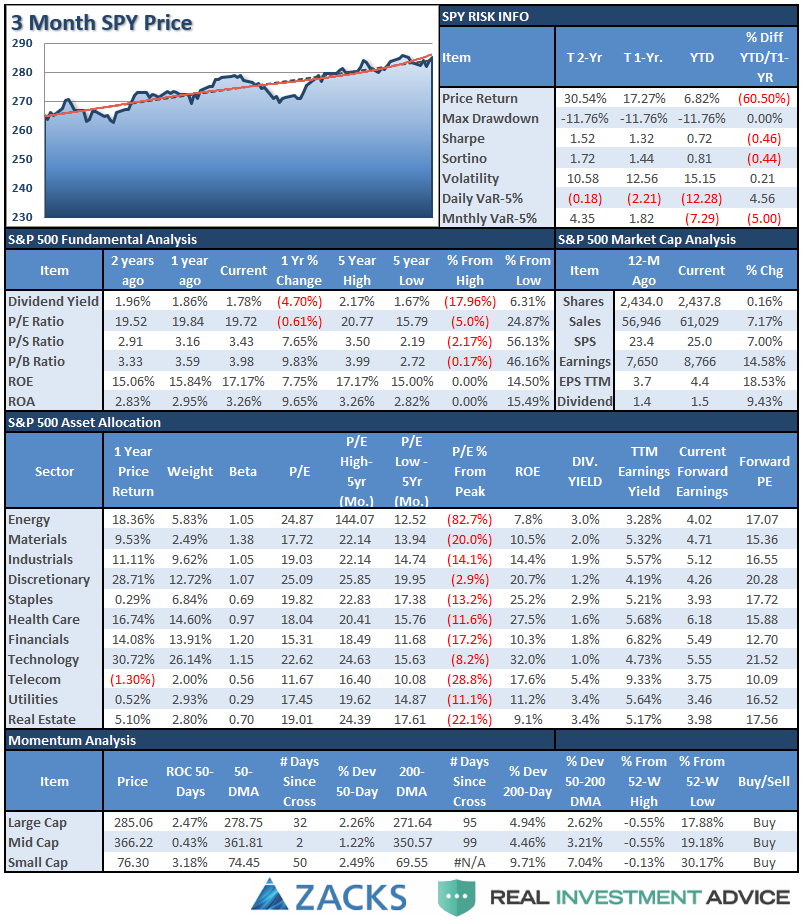
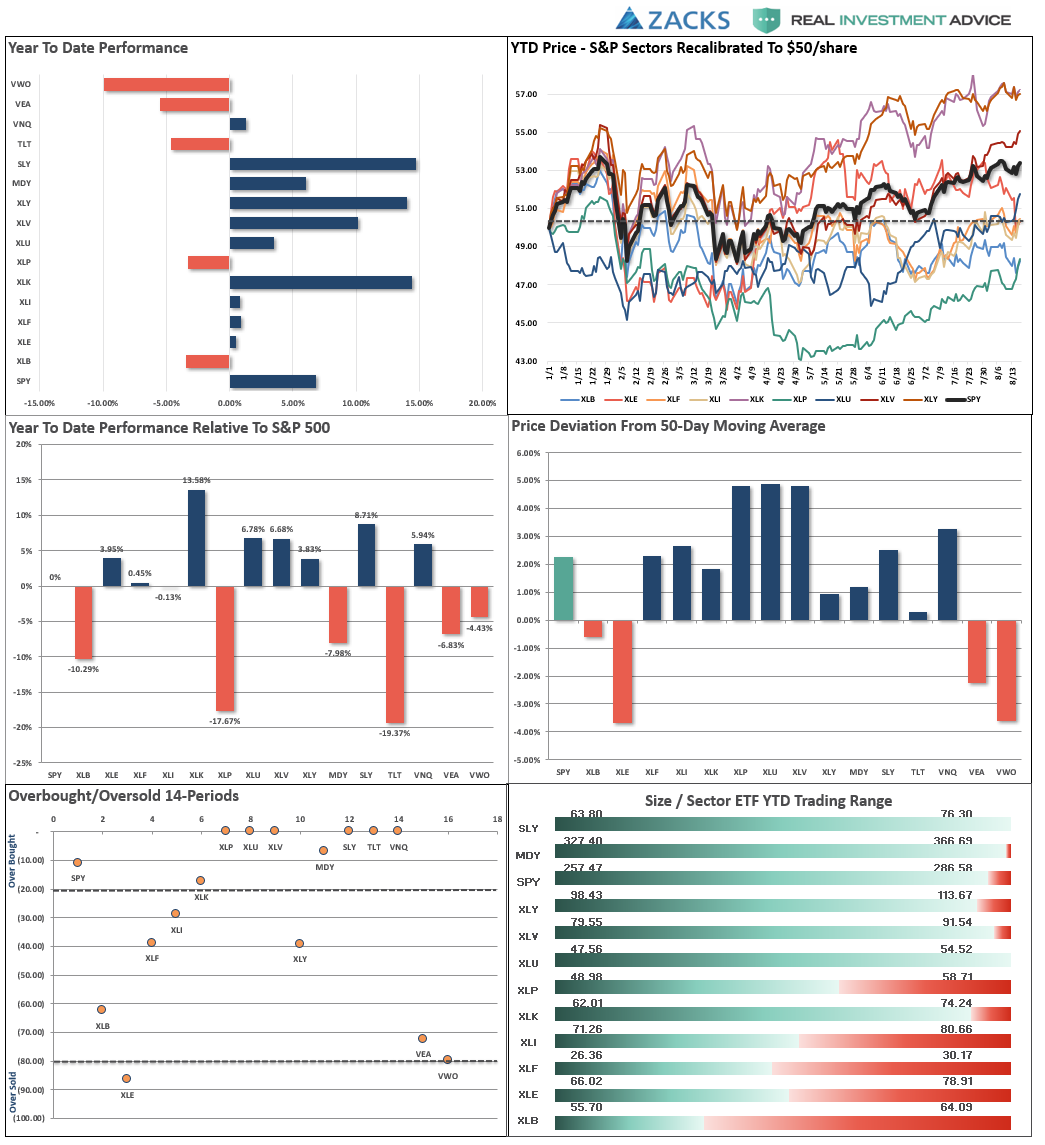
Performance Analysis
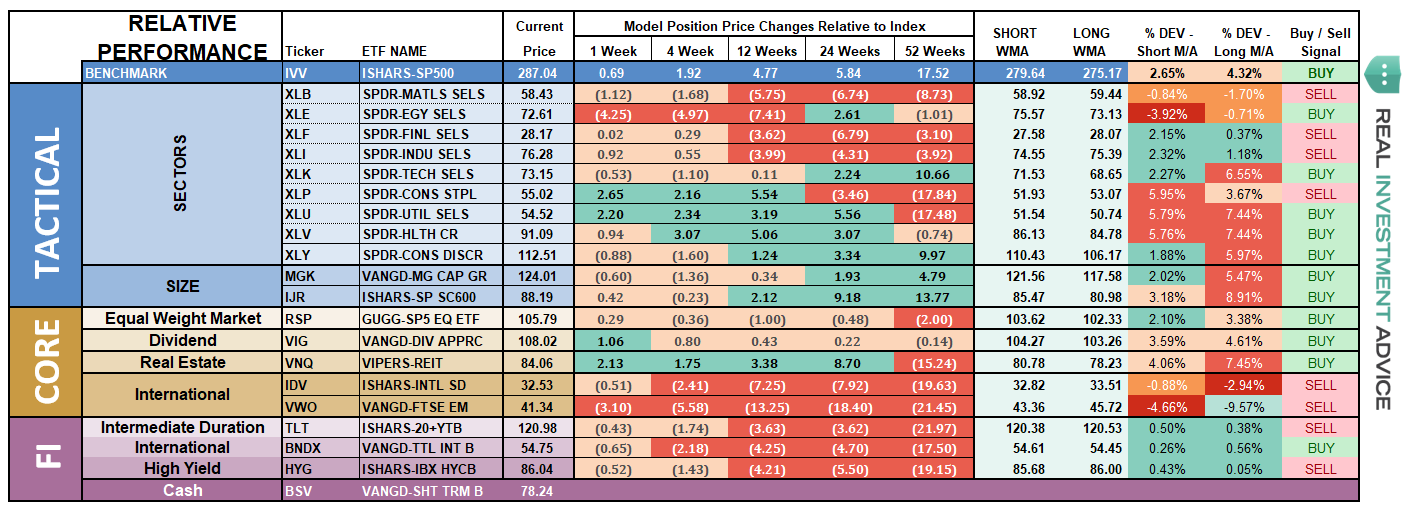
ETF Model Relative Performance Analysis
Sector and Market Analysis:
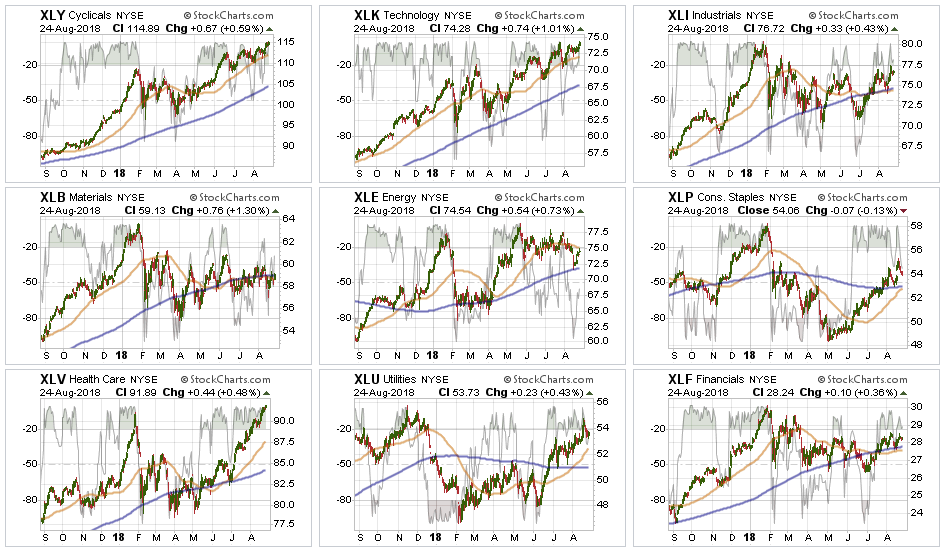
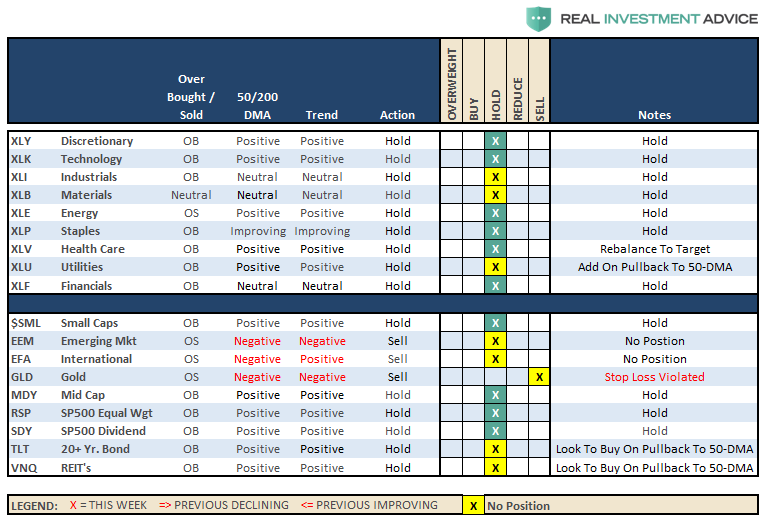
Discretionary, Technology and Healthcare – continue to pace the way higher in the market over the last few weeks. We continue to hold our weightings in these sectors, outside of just trimming position sizes to account for gains for now. With the sectors VERY overbought and extended currently use pullbacks for adding to exposure or increasing target weights.
Staples and Utilities – have regained strength after a very tough start to the year. As we stated last week, there is a movement to more defensive sectors of the market (late economic stage sectors) that is still occurring. Use pullbacks to support, and oversold conditions, to add exposure accordingly.
Financial, Energy, Industrial and Material – while Industrial finally gained a bit of momentum due to earnings season, the risk of an ongoing, and acceleration of, tariffs and “trade wars” keeps us out of both the Industrial and Materials sector for now. However, with that said, Industrials' performance is improving and on a pullback to support that doesn’t violate it, we may consider adding a small exposure. Energy’s recent slump successfully tested the 200-dma. With the sector oversold, a trading entry is available, but with the 50-dma just overhead stops should be placed at the recent lows. Financials continue to languish along support but not showing much in the way of strength to support overweighting the sector currently.
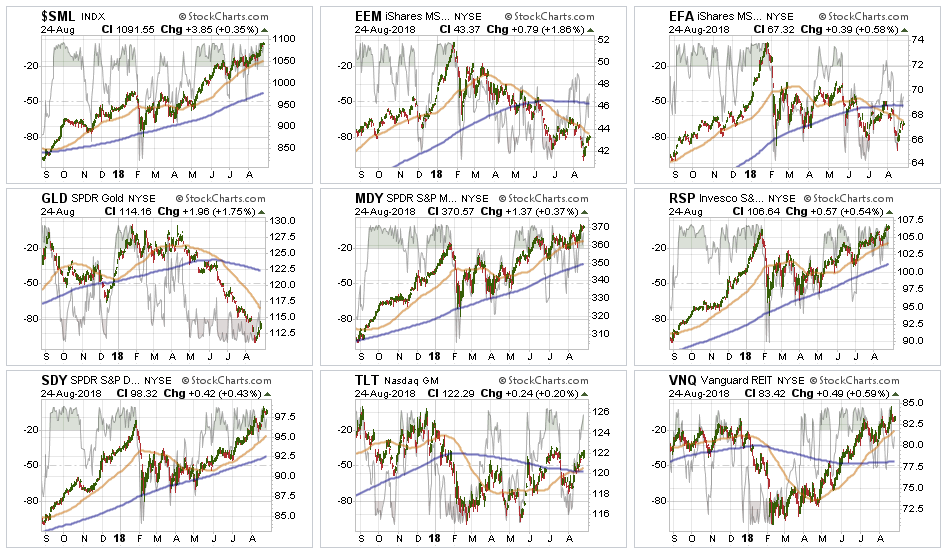
Small-Cap and Mid-Cap continue to perform well and after adding exposure to these areas a few weeks ago, there is little to do currently. With these markets extremely overbought and extended, pullbacks to support is needed to add additional exposure.
Emerging and International Markets were removed in January from portfolios on the basis that “trade wars” and “rising rates” were not good for these groups. With the addition of the “Turkey Crisis,” ongoing tariffs, and trade wars, there is simply no reason to add “drag” to a portfolio currently. These two markets are likely to get much worse before they get better. Put stops on all positions.
Dividends and Equal Weight continue to hold their own and we continue to hold our allocations to these “core holdings.” We will overweight these positions on a pullback to support that does not violate that level.
Gold – If you are still hanging onto gold, we have been consistently providing stop loss levels and sell points since May of this year. These points have continued to decline. With gold very oversold on a short-term basis, if you are still long the metal, your stop has been lowered from $117 four weeks ago, to $111 this week. A rally sale point has also declined from the previous level of $121 to $114.
Bonds – This past week, bonds continued to rally as money looked for “safety” amid the concerns of a collapse in the Turkish lira. The rally over the past two weeks establishes a series of rising bottoms for bonds AND we have now registered an important “BUY” signal for bonds as the 50-dma crosses back above the 200-dma. As noted previously, we remain out of trading positions currently but remain long “core” bond holdings mostly in floating rate and shorter duration exposure. However, with a “buy” signal in place, we will look to add trading positions back into portfolios as necessary.
REITS keep bouncing off the 50-dma like clockwork. Despite rising rates, the sector has continued to catch a share of money flows and the entire backdrop is bullish for REITs. However, with the sector very overbought, take profits and rebalance back to weight and look for pullbacks to support to add exposure.
The table below shows thoughts on specific actions related to the current market environment.
(These are not recommendations or solicitations to take any action. This is for informational purposes only related to market extremes and contrarian positioning within portfolios. Use at your own risk and peril.)
Portfolio/Client Update:
Over the last few weeks, I have discussed the increases to equity exposure in portfolios as the market’s momentum has continued to push higher. However, we have done this cautiously by using pullbacks to support that subsequently broke out above resistance to do so. As I stated last week:
“The recent corrective action was not sustained long enough to provide an opportunity to add to existing positions. However, we suspect over the next month or so that opportunity will present itself given what is happening globally. As long as the cluster of support at the 50- and 100-dma remains in place, which limits much of the downside risk currently, and pullback to support at 2800 will provide an opportunity to add further exposure and bring portfolios closer to target model weights.”
Over the past two weeks, the market did pull back to support at 2800 and subsequently broke out to new highs on Friday. With that, we will look to add equity exposure opportunistically over the next couple of weeks in accordance with the model allocations.
- New clients: Add 50% of target equity allocations.
- Equity Model: We sold three laggards last week (Chevron (NYSE:CVX), Constellation Brands (NYSE:STZ) and Eastman Chemical (NYSE:EMN)) and will replace with new positions opportunistically.
- Equity/ETF blended – Same as with the equity model.
- ETF Model: We will overweight core “domestic” indices by adding a pure S&P 500 index ETF to offset lack of international exposure. We remain overweight outperforming sectors to offset underweights in underperforming sectors.
- Option-Wrapped Equity Model sold CVX and will add two new positions opportunistically.
Again, we are moving cautiously. There is mounting evidence of short to intermediate-term risk of which we are very aware. However, the trend of the market remains positive, and we realize that short-term performance is just as important as long-term. It is always a challenge to marry both.
It is important to understand that when we add to our equity allocations, ALL purchases are initially “trades” that can, and will, be closed out quickly if they fail to work as anticipated. This is why we “step” into positions initially. Once a “trade” begins to work as anticipated, it is then brought to the appropriate portfolio weight and becomes a long-term investment. We will unwind these actions either by reducing, selling, or hedging, if the market environment changes for the worse.

