Monday, we talked about transitory inflation and decided that if general demand for goods was to continue with such strength, one of the best places to keep an eye on for investing opportunities could be in soft commodities.
Not only must people eat, but as travel picks up its pace, along with restaurants moving back to full capacity, we can expect demand to follow.
However, this poses a problem if we come into any types of food shortages caused by supply chain disruptions or drought.

Since food commodities work on 2–3-year cycles, it takes much more time to increase supply. This could create sudden price spikes if supplies run thin.
It should also be noted that the Fed does not watch food as an indicator for inflation and therefore does not have a complete picture of the economic outlook. With that said, the Feds' stance continues to look at inflation from a temporary standpoint and urges investors not to worry.
As technical traders, we are always watching price action and this blindsight from the Fed could be a great opportunity to enter trades in some of the most popular food commodity ETFs.
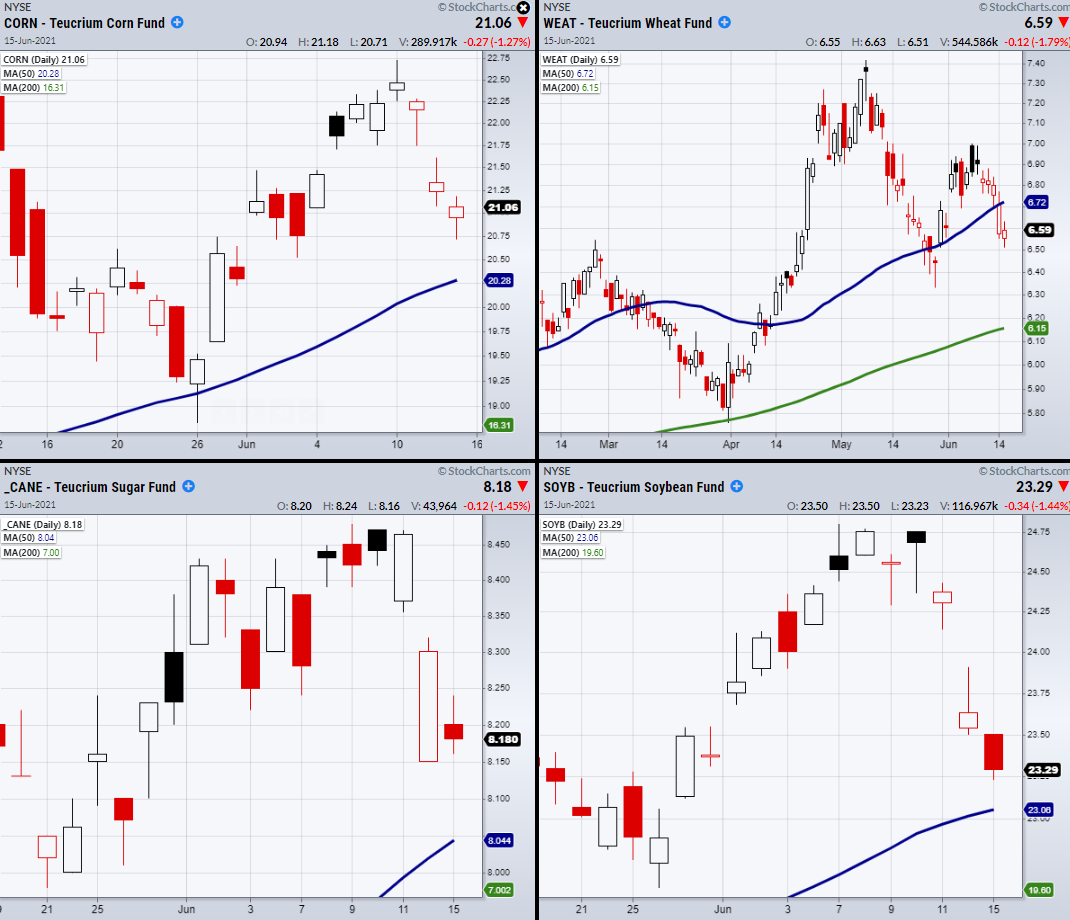
Above is a chart of Corn—Teucrium Corn Fund (NYSE:CORN), Soybeans—Teucrium Soybean (NYSE:SOYB) Sugar—Teucrium Sugar (NYSE:CANE), and Wheat—Teucrium Wheat (NYSE:WEAT).
Besides WEAT, all are currently holding above their 50-Day moving average, while WEAT is near support from its highs dating back to late February.
Since March 2020, each has made large strides in price and are holding their long-term upward trend. If they continue to hold or bounce off these key price levels created from support or the 50-DMA, this could offer a low-risk entry into these safety plays.
ETF Summary
- S&P 500 (SPY) 422.82 new support.
- Russell 2000 (IWM) Holding over the 10-DMA at 229.92.
- Dow (DIA) Support 341.84 the 50-DMA.
- NASDAQ (QQQ) 342.80 pivotal area.
- KRE (Regional Banks) 68.91 the 50-DMA.
- SMH (Semiconductors) 245.19 support. 258.59 resistance.
- IYT (Transportation) 264.70 pivotal area. 268.85 resistance.
- IBB (Biotechnology) 159.37 support to hold.
- XRT (Retail) Main support the 50-DMA 93.05
- Volatility Index (VXX) 32.83 resistance.
- Junk Bonds (JNK)109.65 resistance.
- XLU (Utilities) Needs to hold 65.80 the 50-DMA.
- SLV (Silver) 25.47 support.
- VBK (Small Cap Growth ETF) 288.11resistance.
- UGA (US Gas Fund) sitting in pivotal support area.
- TLT (iShares 20+ Year Treasuries) 140.52 the 10-DMA.
- USD (Dollar) Needs to clear and hold over the 50-DMA at 90.64.
- MJ (Alternative Harvest ETF) Broke the 50-DMA at 21.01.
- LIT (Lithium) 72.70 next resistance area.
- XOP (Oil and Gas Exploration) 95 support.
- DBA (Agriculture) Holding over 18.36 the 50-DMA.
- GLD (Gold Trust) Watching to hold 200-DMA at 172.78
