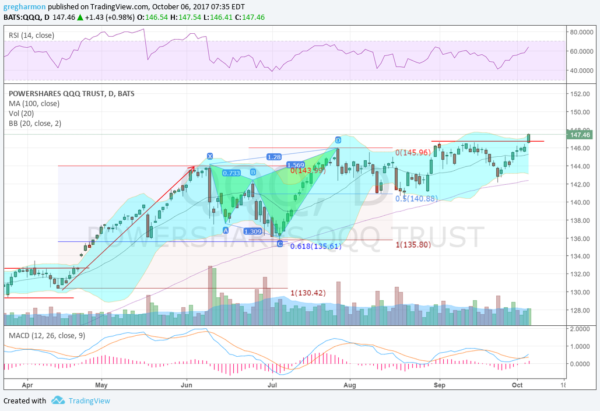
Well our patience has been rewarded. Just 3 days ago we were asking here why the NASDAQ 100 was lagging behind the Russell and S&P. It had just stalled at its prior high and made an intraday reversal again. Thursday it broke above that 2 month range and continued to close at a new all-time high. The chart of the NASDAQ 100 ETF (NASDAQ:QQQ) below shows the recent price action.
The NASDAQ was left buried in the sand in June after a move higher out of consolidation in April. It pulled back 61.8% of the move higher through a bearish Shark harmonic pattern that completed at the end of July, near the 100 day SMA. It then retraced 50% of that pattern to a low in mid-August. The bounce made a marginally higher high but stalled again.

But the pullback this time made a higher low 2 weeks ago and it reversed higher again. Now into all-time high territory it looks strong. The RSI is making a higher high and has room to run up. The MACD is just crossing up. And the Bollinger Bands are opening to the upside. All of these indicators support further upside price action.
DISCLAIMER: The information in this blog post represents my own opinions and does not contain a recommendation for any particular security or investment. I or my affiliates may hold positions or other interests in securities mentioned in the Blog, please see my Disclaimer page for my full disclaimer.
