US 10-year bond yields have moved through a number of key levels and are on the cusp of a major breakout. Regular readers know by now that I prefer to look at multiple indicators and charts to form a more holistic view on a market, and this time is no different. Following are 4 charts on what may well become the 4th bond market tantrum since 2013.
Looking across the charts, global sovereign bond market breadth, composite measures of Treasuries sentiment, economic cycle indicators, and bond market implied volatility all point to a potentially major move getting underway. Certainly I would say at this point the weight of the risks are to the upside for bond yields, and this could drive a major shift in market sentiment this year.
The key takeaways for the outlook for bond yields are:
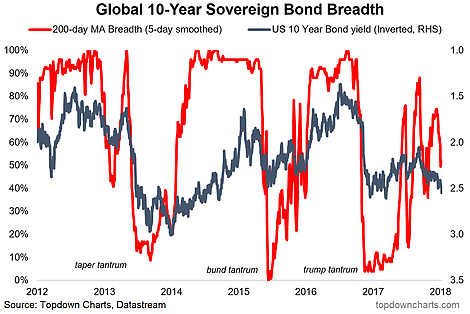
- Global sovereign bond market breadth is breaking down from already poor levels, which is a key sign the current move in bond yields could go further.
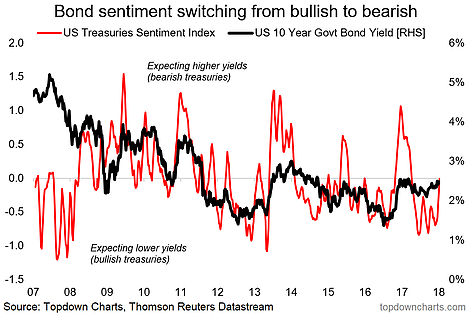
- The composite Treasuries sentiment indicator has shifted from extreme bullish (a contrarian bearish signal) to neutral levels (momentum has taken over now).
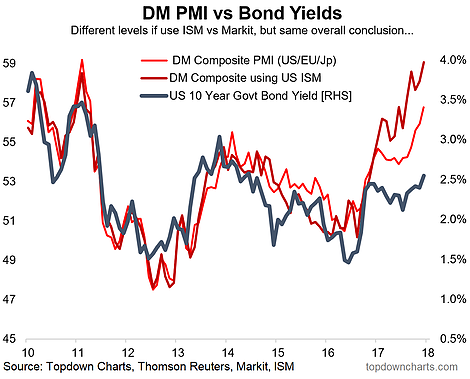
- Macroeconomic cycle metrics point to an improved growth/inflation outlook across developed economies, which is a key fundamental input in the upside risk case for bond yields.
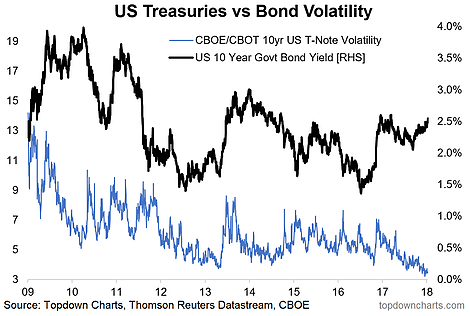
- Bond market implied volatility has crunched to record lows, and this could be a sign that a major move is about to commence.
1. Global Sovereign Bond Breadth: An interesting thing has happened in global sovereign bond market breadth - since the "Trump Tantrum" (the 3rd tantrum since 2013) bond market breadth has failed to really recover the way it did after the previous 2 tantrums. At this point there is quite a way for breadth to go before getting "oversold"

2. Bond Sentiment: Similarly, bond market sentiment is undergoing a rapid shift from a period of bullishness to very slightly bearish. I expect this to continue and again, on this metric, there is quite some way to go before it hits an extreme which would indicate risk of a reversal or exhaustion of the current move upwards in bond yields. To be clear, the *signal* has gone from contrarian bearish to momentum bearish.

3. The Economic Cycle: From a global macroeconomic cycle perspective the growth and inflation outlook is looking the best in years. While monetary policy matters (particularly as the ECB and BoJ had been suppressing yields), ultimately the market follows the data, and the data says bond yields go higher. Certainly at least the weight of risk is to the upside.

4. Bond Market Volatility: And fnally, on bond market volatility there has been a very curious crunch down which looks eerily similar to that seen just prior to the taper tantrum in 2013. What's also interesting is the divergence in yields (up) and implied volatility (down). This is a clue—a telltale sign—of a potentially significant move about to commence.

