“IAM” is the online name of one of our professional trader friends who writes a respected private newsletter to be shared with just a few friends and colleagues. He lets us share the newsletter with you, our readers. We offer it to you largely unedited, so you can see how professionals think and what they talk about. All views belong to the writer.
Last week, earnings did something that many traders and investors should delve into a little deeper. During earnings season, the market looks a bit deeper into it’s crystal ball. Radar calls it pre-earnings discounting.
Q2 is now 90% known. Earnings and prices have nicely exceed Q2 estimates. The market has “priced-in” the nice beats of expectations. Valuations have probed higher anticipating better and up. Prices have been rising as earnings delivered beats.
“S&P 500 Companies See Worst Price Reaction to Positive EPS Surprises since Q2 2011. To date, more than 90% of the companies in the S&P 500 have reported earnings for the second quarter. Of these companies, 73% have reported actual EPS above the mean EPS estimate, which is above the 5-year average of 68%. In aggregate, earnings have exceeded expectations by 6.1%, which is also above the 5-year average of 4.1%. Due to these upside surprises, the earnings growth rate for the S&P 500 has improved to 10.2% today from 6.4% on June 30.” FactSet.
“Earnings Scorecard: As of today (with 91% of the companies in the S&P 500 reporting actual results for Q2 2017), 73% of S&P 500 companies have reported positive EPS surprises and 69% have reported positive sales surprises. • Earnings Growth: For Q2 2017, the blended earnings growth rate for the S&P 500 is 10.2%. Ten sectors are reporting or have reported earnings growth for the quarter, led by the Energy sector. • Earnings Guidance: For Q3 2017, 59 S&P 500 companies have issued negative EPS guidance and 35 S&P 500 companies have issued positive EPS guidance.” FactSet.
“Why is the market punishing companies (on average) that have reported positive earnings surprises? It is likely not due to forward EPS guidance or analyst revisions to EPS estimates for the third quarter. To date, fewer S&P 500 companies have issued negative EPS guidance and more S&P 500 companies have issued positive EPS guidance for Q3 2017 than average. In aggregate, analysts made smaller cuts than average to third quarter EPS estimates during the month of July (https://insight.factset.com/below-average-cuts-to-q3-eps-estimates-for-sp-500-companies-in-july).” FactSet.
Each quarter, Radar looks to meets, beats and upward/downward guidance. Radar would argue that the market rose because earnings beat 11,100 S&P 500 analysts forecasts. During the quarter the market expanded value and formed a value area. It rose to 2488.50 “All-Time-Highs” and appears to have nearly completely discounted what the market was guided to. Radar had a rough estimate of 2496’s. The market came to within 7.5 points of that target before backing up the parade. Radar believes the Bulls are still in charge, however, since the market has already reacted to what it thought it would see for Q2, it has effectively priced itself to perceived value.
Now the focus rolls from Q2 to Q3. Q2 is becoming history. Q3 releases will not begin until October. If you read closely, the Q3 estimates have begun the normal process of Q3 pre-earnings season adjustments. Analysts do this every quarter. They sharpen their pencils and don’t want to be overly-optimistic. Analysts will adjust to what they see and what they think they will see. It is still noticeably up and better, but not as much as it has been, but not down much either, just yet.
Let’s look at the suspected adjustment.
From last week’s Radar:
“Earnings for Q2 appear to be on track for nice beats of estimates. Last week there were downgrades for 12 months out. This poses a concern for testing value lower. Radar had been looking for 2496’s as fully discounting value high for Q2, possibly 2525. Inflation is not seemingly a worry at this time. The Fed’s Balance Sheet showed scant change this week. The next Fed rate increase is being anticipated before year end. Maybe September and maybe December.”
Once the market priced in fuller levels 2488.50, the sharp downward test of August’s Value Area began.
Now look at the value and market structure tests.

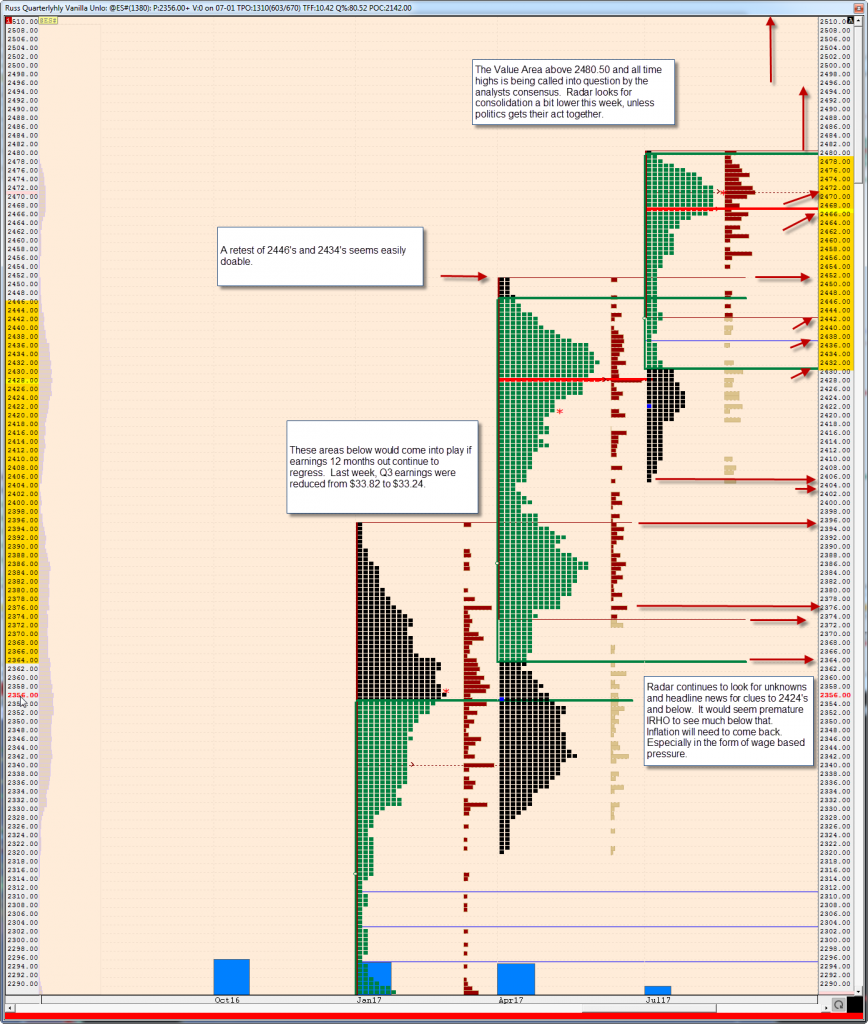
If you expand the chart, you will see a red arrow pointing to 2430.25 (Developing Value Low) on this developing quarterly chart. This chart season is for Q2 earnings releases and Q3 trading. Now Q3 becomes the focus.
This is from last week’s Radar.
“This week it will be important to hold 2466’s. Below that 2438. If earnings downgrades 12 months out, then 2434.25 and 2424.25, then 2408’s/2402.50. We won’t know down what the downgrades are until after the fact. Many will know and trade with the estimates they have. This Is extremely valuable consensus guidance. That is why it is not released until after the market acts. Radar will provide the latest guidance it sees to that end.”
This was written last Saturday!
For this week, August 12, Radar would not rule out a bit higher. Possibly 2451/2453.50, 2455 and 2464/2466’s; find resistance and then, the pre-Q3 earnings adjustment looks lower, IRHO. What tests lower might be in order? Well, below 2436’s, 2430.50/2424’s/2408’s/2402.50/2396’s/2386’s/2374’s look like plausible test areas. This appears to be sufficient for the week. If event risk comes in strong, then there are levels below these.
Bloomberg showed chances of Fed Action at zero for the September meeting. Politics regarding Tax Reform, Infrastructure, and ACA may still be in order. We have not seen serious Fed tightening just yet, IRHO. A Primary Discount Rate of 2.25% gets Radar concerned!
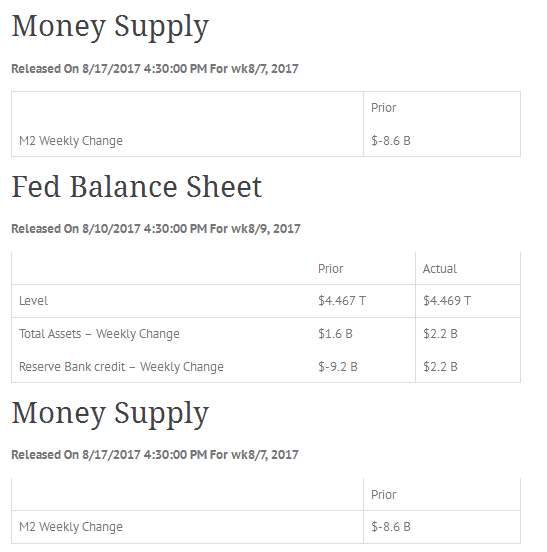
All of the sites Radar uses are open source. Econoday is used for the Fed Numbers. It should be noted that each red arrow on every chart is a possible support or resistance. The observation at each point is considered as a target or destination. Trade setups that result are also considered.
I have written this article myself and it expresses my opinions. I am not receiving any compensation or gratuities for it. None! Radar follows news sources it believes are highly reliable.
Radar offers a free observation of things that show up. It cannot be all inclusive! The observations are done through a brief article that takes about five minutes to read each week. It offers ideas and actions that prudent people may want to consider. Radar reads many articles and keeps a calendar to look forward. People make trades. Radar observes Value and Earnings from those trades. Analysts create the consensus view.

Which stock should you buy in your very next trade?
With valuations skyrocketing in 2024, many investors are uneasy putting more money into stocks. Unsure where to invest next? Get access to our proven portfolios and discover high-potential opportunities.
In 2024 alone, ProPicks AI identified 2 stocks that surged over 150%, 4 additional stocks that leaped over 30%, and 3 more that climbed over 25%. That's an impressive track record.
With portfolios tailored for Dow stocks, S&P stocks, Tech stocks, and Mid Cap stocks, you can explore various wealth-building strategies.
