The USD and 2- and 5-year bond yields are key assets to focus on this week, while strong focus should also be placed on the Chinese yuan.
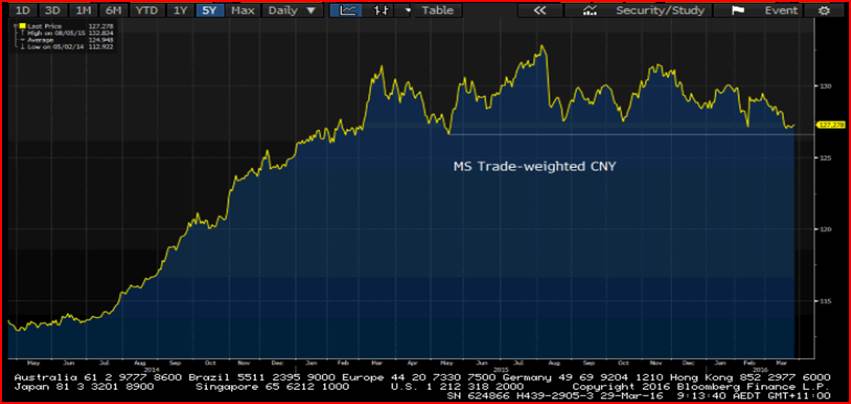
As seen in chart 1, the trade-weighted CNY is ominously close to breaking through the bottom of the consolidation pattern that it’s been trading in since 2015. A break through the 2015 pivot low (highlighted by the white horizontal line) will not be taken well by risk assets and could be a huge catalyst for increased volatility again. The fact that the People’s Bank of China (PBoC) ‘fixed’ the CNY stronger by 172 pips certainly helps to arrest this concern for now.
Friday’s March China manufacturing and services PMI data (released at 12:00 AEDT) is another key event risk, where both data points are expected to contract at a slower pace.
Chart 1 – Morgan Stanley’s trade-weighted CNY
In terms of USD drivers, there is a barrage of various USD catalysts to focus on this week. Yesterday we saw US core PCE increase at slightly below expectations 1.7% year-on-year, although the Atlanta Fed’s Q1 GDP model being revised down to a meagre 0.6% from 1.4% (Q1 GDP released on 28 April) has claimed the lion’s share of the headlines and presumably taken some of the wind out of the USD sails.
Fed speakers will turn the noise up a notch this week; we have NY Fed President Bill Dudley (core voter), Dallas Fed President Rob Kaplan, Chicago Fed President Charles Evans and San Francisco President John Williams on the docket. Bill Dudley is clearly the drawcard given his dovish comments in the lead up to 16 March Federal Open Market Committee (FOMC) meet. He speaks early Friday morning at 01:00 AEDT.
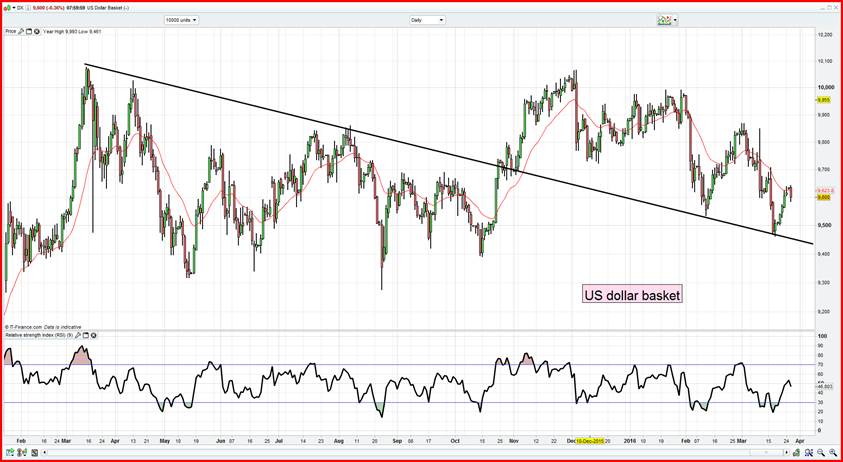
Without a doubt though, Janet Yellen’s speech tomorrow morning (03:20 AEDT) at the Economic Club of New York is the highlight. The probability of the Fed Chair being overly upbeat and hawkish is low and, to be fair, no one is really putting any weight on the April meeting being a ‘live’ one, but the June meeting probably is. The interest rate markets see a further hike in June as a 36% probability, so in theory, Ms Yellen only really needs to acknowledge the improvement in inflation forces and we could see the USD rally. As chart 2 shows, the USD is still trending lower and after a bounce off trend support better sellers have been seen today. The USD is the guide this week, especially with US payrolls on Friday (consensus 210,000 jobs), With a good number, and wage growth above 2.4%, means the probability of a June hike will gravitate back towards 50%. The doves will state their case if we see a poor number .
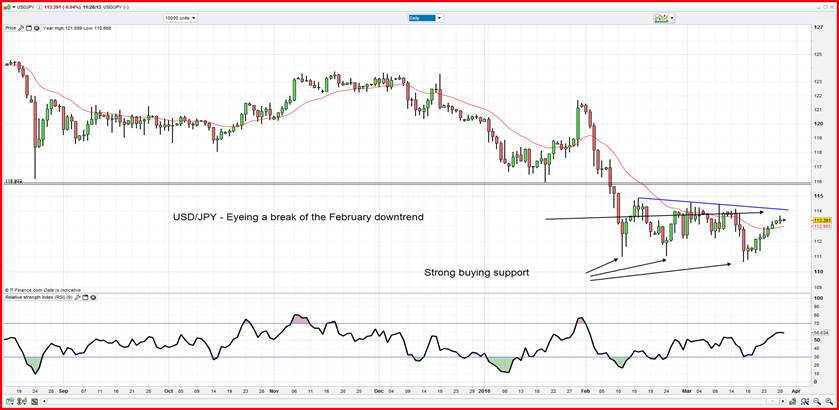
USD/JPY seems to be getting some attention for potential upside in the near-term. For those who adhere to seasonal patterns, keep in mind that the pair has rallied throughout March for the past eight consecutive years! What’s more, positioning in the JPY is still one-side and the speculative community is running one of the largest net long JPY futures positions ever!
The technicals are certainly looking more constructive, there has been really strong buying into ¥111.00 as shown on the daily chart and this should be used as a guide for stops. I like the idea of being long on pullbacks to ¥113.00 for ¥115.80, although increased conviction needs to come from a closing break of the February downtrend at ¥114.00.
There is still an opportunity for Japanese investors to hunt for yield, especially with the two-year US treasury commanding a 109 basis point premium over the Japanese government bond. This should keep USD/JPY into fiscal year end.
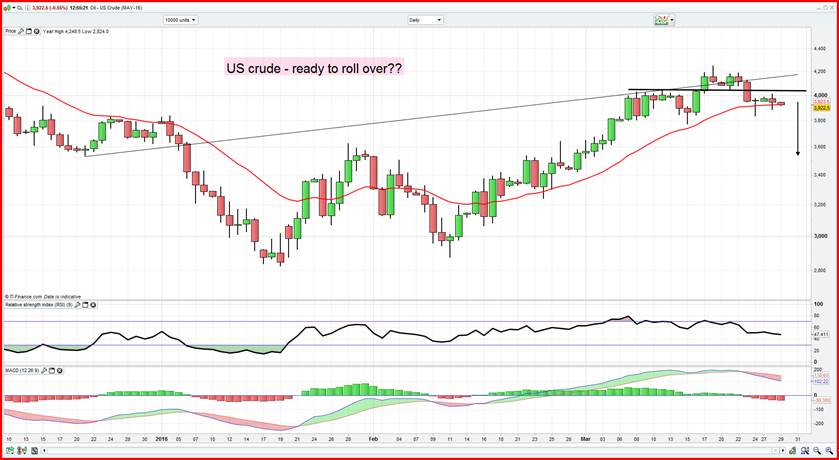
Moves in the USD should resonate in oil and the S&P 500 as well. The big catalyst for oil (outside USD moves) is Thursday’s inventory report (01:30 AEDT) where oil analysts are expecting 2.27 million barrels of extra inventory. The US crude (May contract) is holding below the key $40.40 – how price reacts around here is key. Looking at the RSI and MACD (lower panes), we can see momentum is headed to the downside. Again, while the technicals are looking shaky, the USD is key.
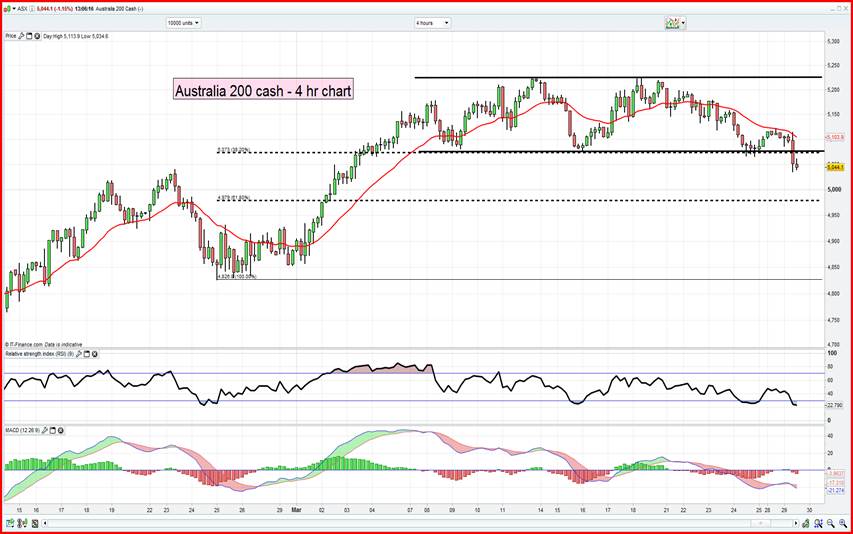
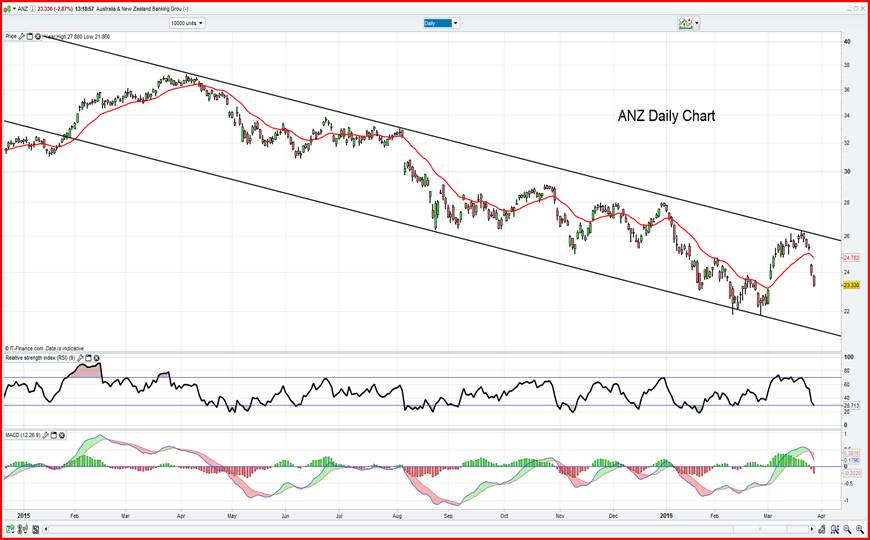
Last week I noted the range the ASX 200 had been in throughout March and was keen to see how price reacted on a break. We’ve seen the downside break today, although volume is terrible and some 40% below the 30-day average for the same time of day (13:15 today). Banks (see the ANZ chart below) have been at the heart of the selling again and the prosepct of further downside seems high.
Rallies and subsequent rejections of the former range would be shorting opportunites in my opinion.
