Investing.com’s stocks of the week
It’s all about the Fed today and the reaction in markets from all we have heard speaks for itself. I hadn’t expected it to be a volatility event myself, but then if we look at implied vols neither was the market.
I have recorded a short video reviewing the Fed meeting that can be found at the bottom of the article. The focus is on the change in the forward guidance and formal move to a ‘patient’ policy stance. As well as the bank's guidance to adjust the pace and composition of the balance sheet if it is required. I have made mention of liquidity dynamics before, and that the balance sheet, specifically the level of excess reserves in the system is having a huge impact on the USD and sentiment towards U.S. equities, credit and emerging markets more broadly.
The Fed’s balance sheet is the game changer, as a change in the global money supply (we can look here at M2). Although, in reality, while markets may rejoice short-term it’s debatable whether it will turn this synchronized economic downturn around, or whether it is just a vehicle to fight a blazing fire.
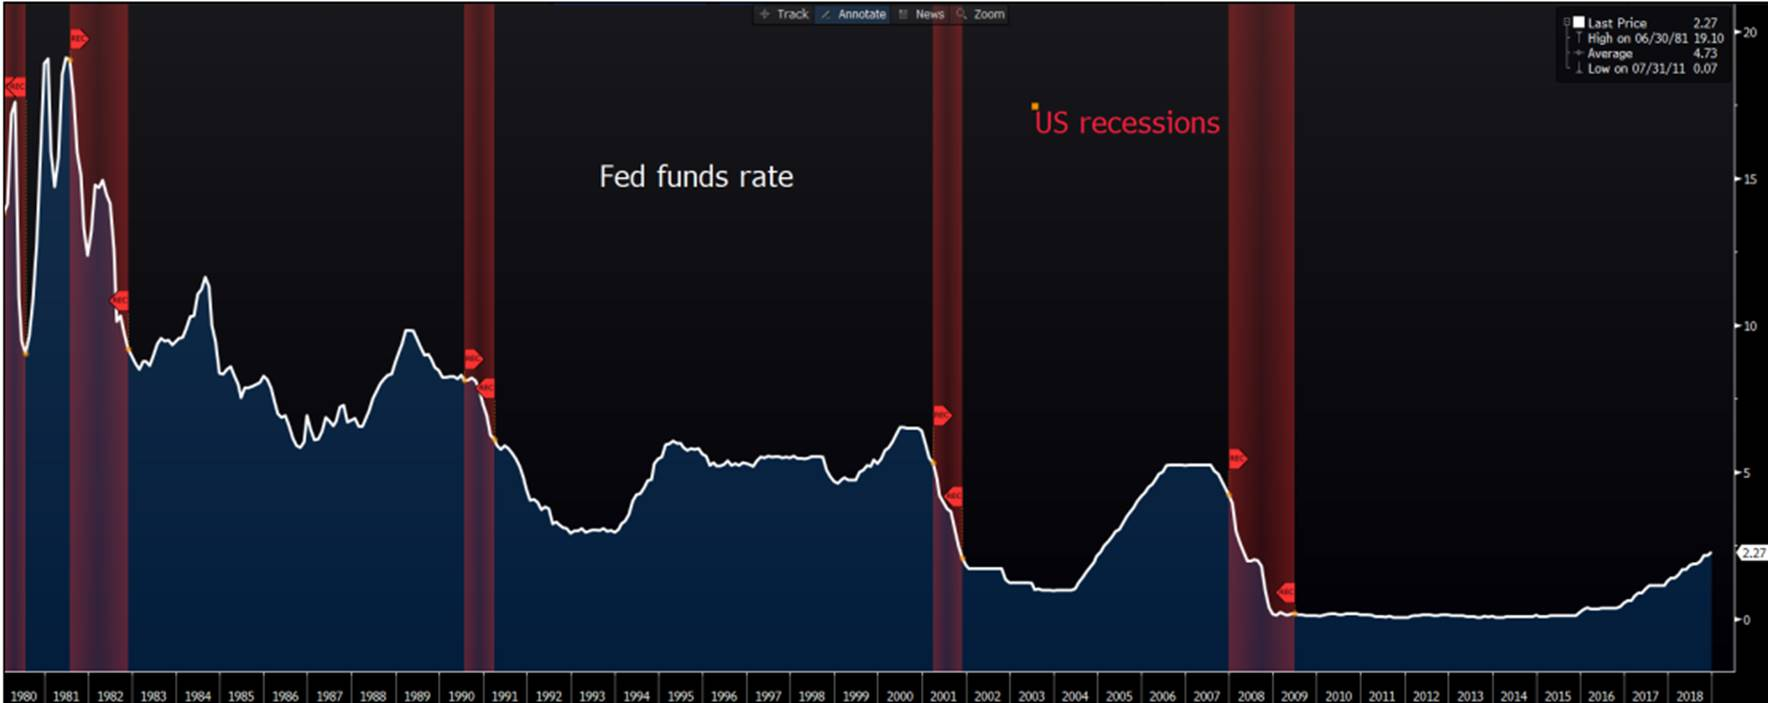
As I suggest that the Fed may have caved to market pressures and told us they wouldn’t be hiking anytime soon – if at all. However, the U.S. rates market tells a very worrying story. That being, we will see the Fed on hold through 2019, with a 76% chance of a cut in 2020. As we can see, into prior U.S. recessions we see a hiking cycle, followed a prolonged pause, then a cut into a recession – this is exactly the message the rates market is telling us now.

The S&P 500 and NASDAQ 100 may have liked what they heard, but this seems to have been driven by a dramatic 12bp drop in ‘real’ 5-year U.S. Treasury yields. Without going into applied finance, lower yields (inflation-adjusted) make the cash flows of U.S.-listed equities relative more attractive and is an important component for business to assess the net present value and internal rate of return for any new investment.
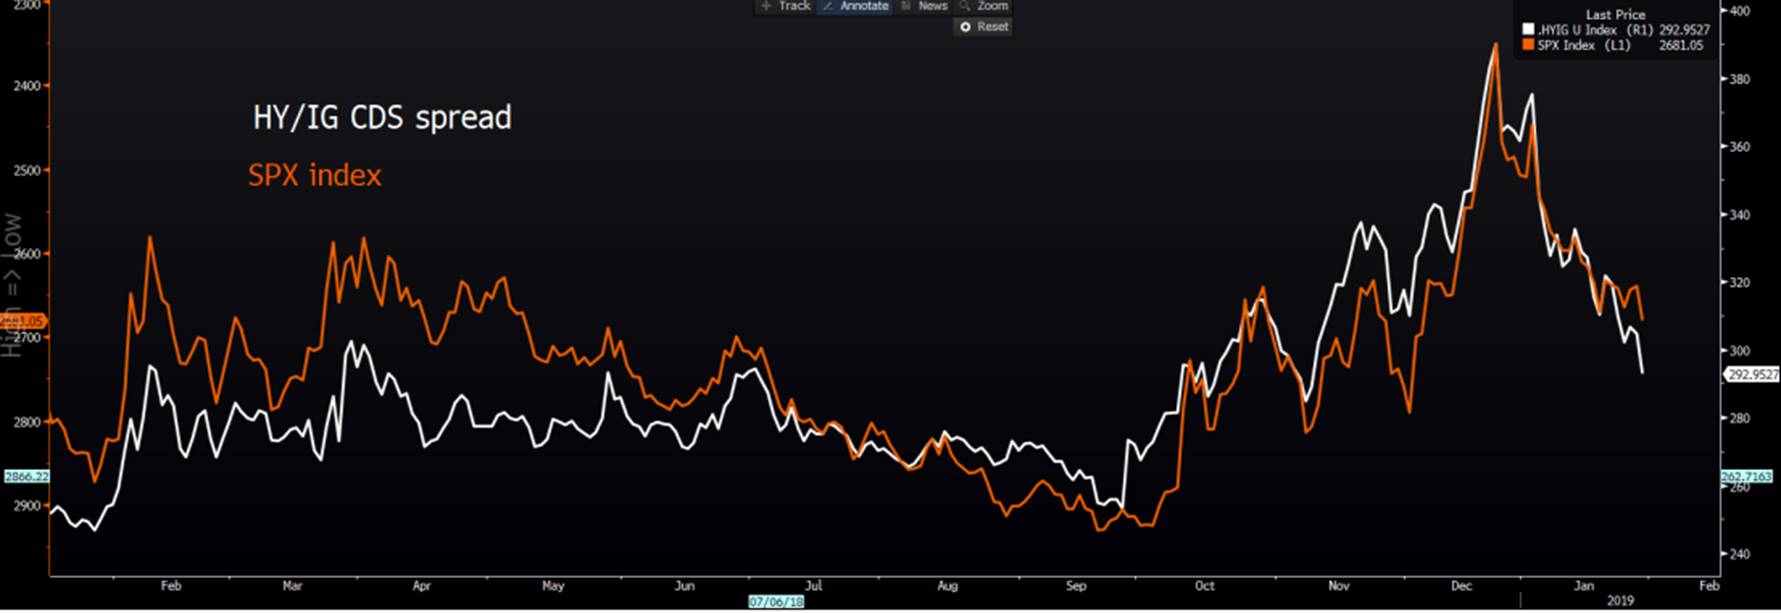
A rampant narrowing of the high yield to investment-grade credit spread is always going to be taken well by U.S. equities. Where, by-and-large, equities always follow credit.

We haven’t seen Asia being blown away with euphoria today, suggesting traders are still cautious, with a beady eye on the US-Sino dialogue and global economics. We have even seen improvement in Chinese PMI data today, although the index sits at 49.5 and remains in contraction. The S&P 500 though has broken out of the recent consolidation range and is testing the September downtrend and a break here would be bullish.
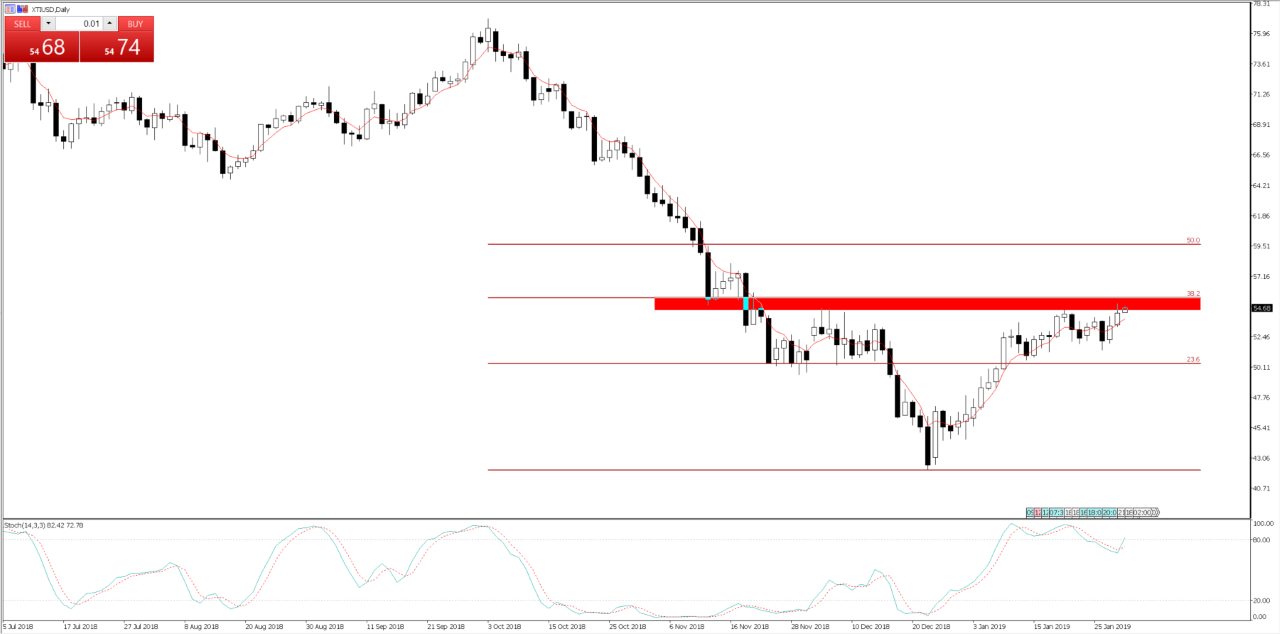
I have also got an eye on crude too, and the 38.2% Fibonacci of the October to December sell-off at $55.55. A close through here would be positive for equities, so watch how price reacts into this level.

