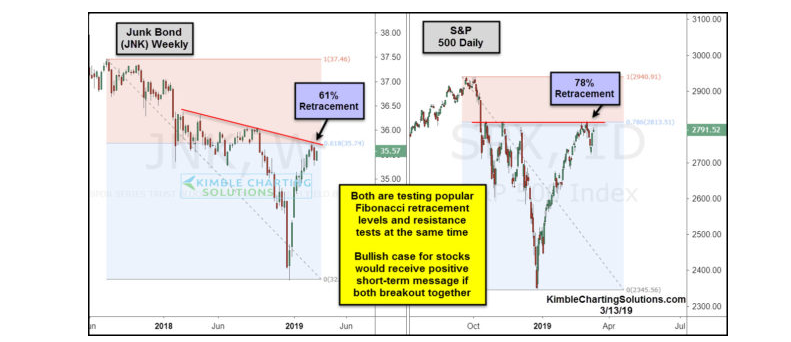
Chris Kimble of Kimble Charting Solutions with a chart out last week showing the coincidental bumping of resistance for both the JNK (high yield ETF) and the S&P 500.
I used the word, “coincidental” but there is causality here. The credit markets have been supporting the move higher in the general equity markets for 2019, since credit spreads started to improve in late December ’18.
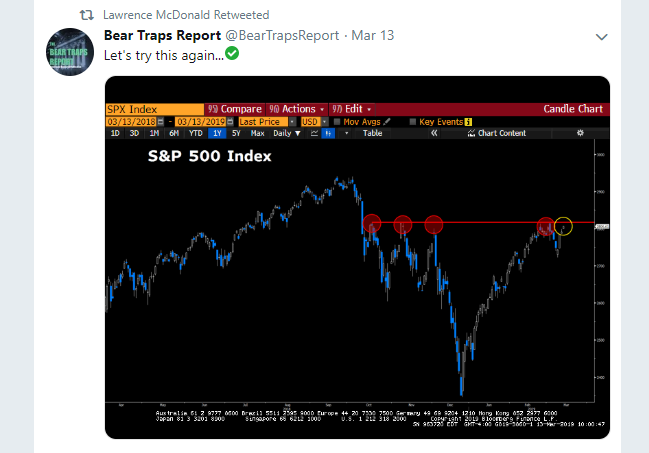
Lawrence McDonald (@convertbond) of the Bear Traps Report (@BearTrapsReport) published this chart on Wednesday, March 13th:

Lawrence McDonald of Bear Traps Report also published this tweet around the same time:
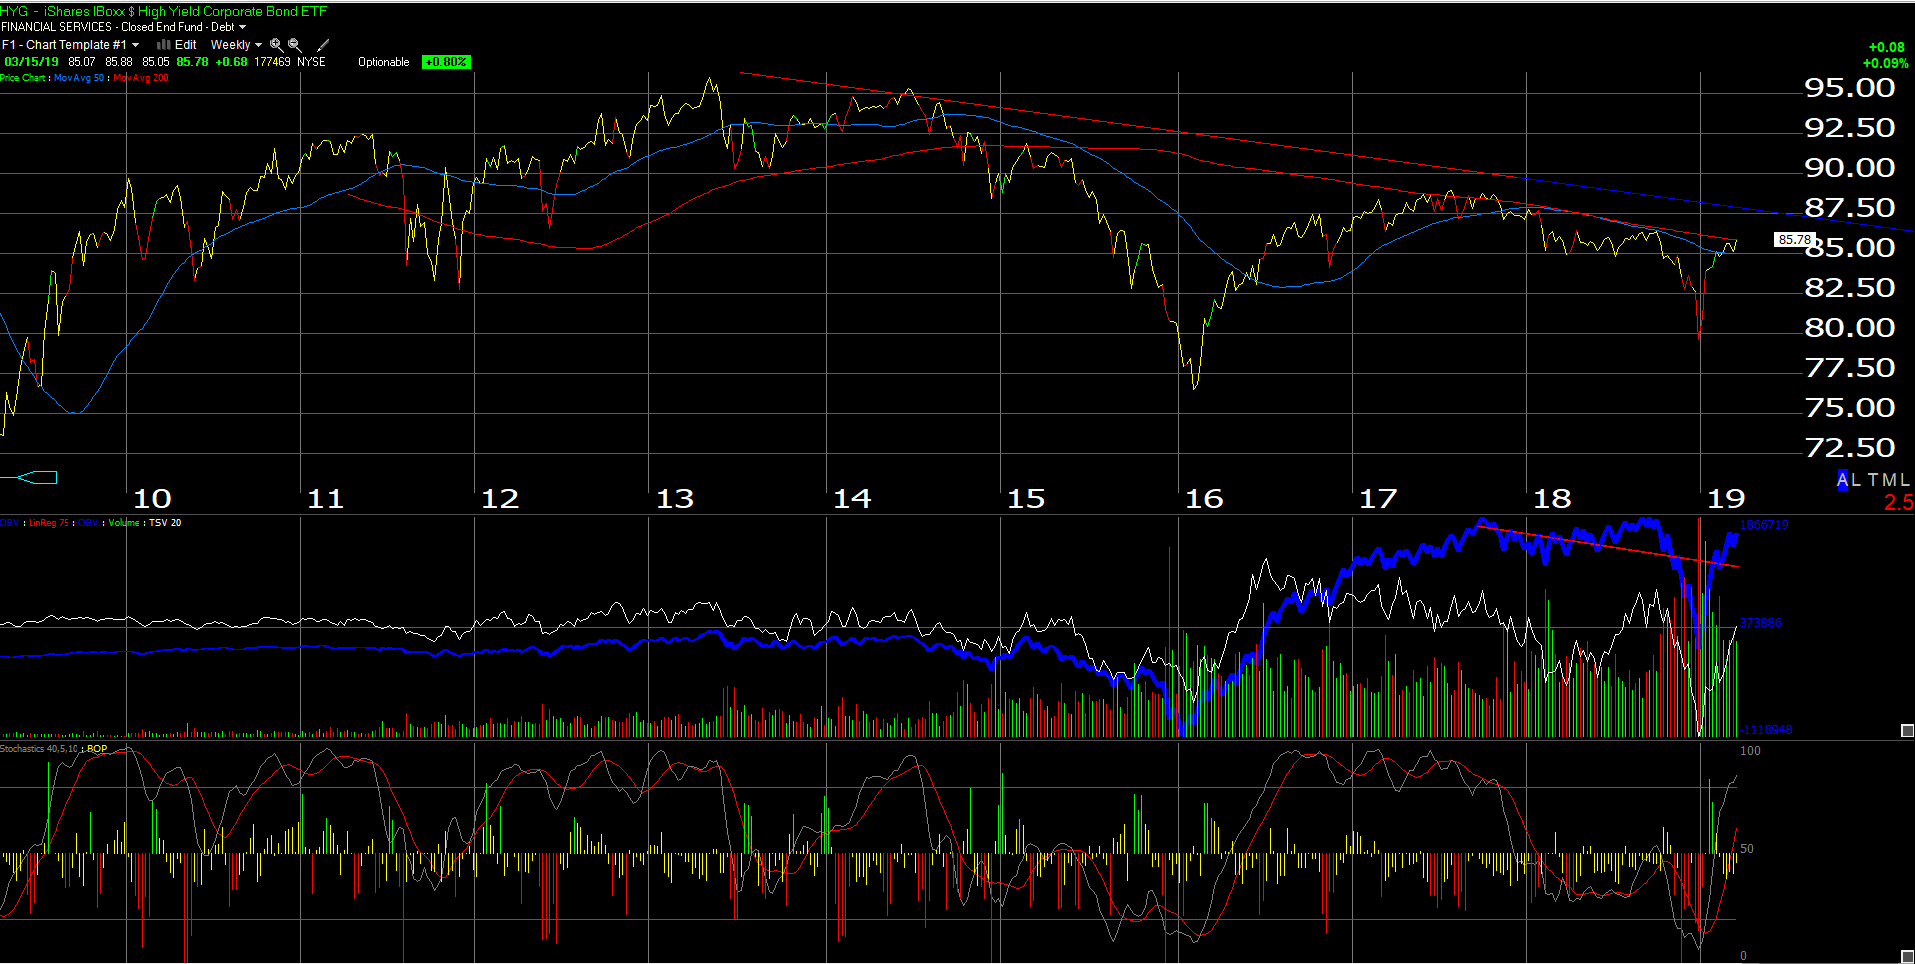
While Chris Kimble uses the JNK high yield ETF, I like to watch theHYG, the iShares high yield ETF which is nearly twice the size of the JNK in terms of assets, $15 bl vs $8 bl.
The HYG is bumping against its 200-week moving average and is not nearly as overbought as it was in late 2016, early 2017.
Analysis / conclusion: The problem with the corporate high-grade and high-yield credit markets is that they are closely correlated to the SP 500 and US equity markets. Since the December 20th, Fed meeting where Jerome Powell came out and made dovish statements about future Fed policy in regards to monetary policy, the SP 500 bottomed December 24th and 26th, 2018 and the high yield credit markets bottomed around the same time.
Yesterday’s blog post noted the previous three corrections for the SP 500 since the 2008 low. The corporate high yield market is acting very similarly to the way it traded after the Q1 ’16 low.
Clients have been sitting in short-term Treasuries and higher-yielding money markets for the last two years, up until late December ’18 and early, 2019. but now own a good chunk of “unconstrained” bond funds and the HYG. It is unlikely we would ever own more than a 15% weight in corporate high yield (ever), but today, clients have the highest allocation they’ve owned since mid-2016. We bought some HYG for clients in Q1 ’18 then sold it late in 2016, early 2017 after the pop in the asset values and the drop in yield.
Don’t kid yourself: corporate high yield has the volatility characteristics of the SP 500 and in times of real crisis like in 2008, when high yield credit spreads widened out to 25% (!), liquidity can be the biggest issue.
However, early 2019 is shaping up like early 2016, and the credit markets are supporting the seeming bottom for the SP 500.
This is an opinion so take it with all opinions, i.e. a substantial degree of skepticism


